Figures & data
Figure 1 Exemplary FMSF baseline traces recorded for a prediabetes patient (male, age range 70–75 y). Changes in the fluorescence signal relative to the normalized baseline (left) and the corresponding Power Spectral Density (PSD) of the fluorescence signal in the intervals of endothelial (<0.021 Hz), neurogenic (0.021–0.052 Hz), and myogenic (0.052–0.15 Hz) activity (right): (A and B) – changes recorded before the appearance of psychological stress; (C and D) – changes observed under prolonged psychological stress; (E and F) – changes observed after a week of therapy with a beta-blocker (nebivolol at a daily dose of 1.25 mg).
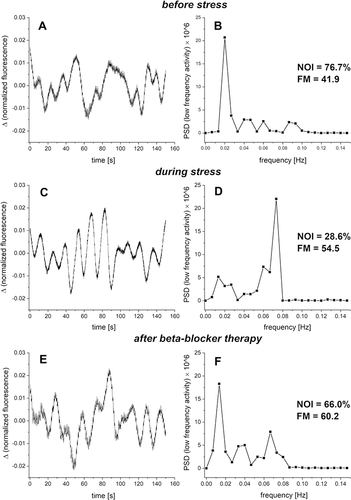
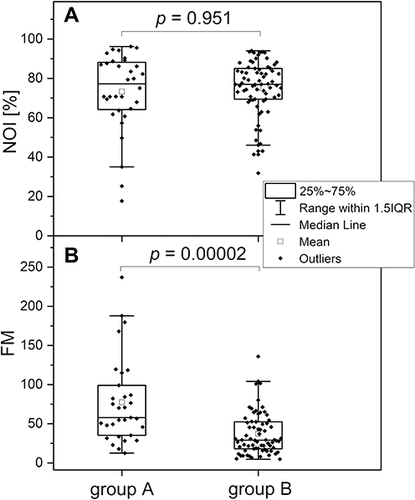
Figure 2 Comparison of the NOI (A) and FM (B) parameters in groups A and B (group A healthy middle-aged individuals, n=32, 19m, 13f, mean age 37.8 (30–50 y)); (group B diabetes type 2 patients, n=70, 38m, 32f, mean age 63.1 (45–80y.)). Differences between the parameters of the compared groups were considered statistically significant when p<0.05. The p-values were calculated from the results of the Mann–Whitney test.