
Figures & data
Figure 1 Flowchart showing the patients’ inclusion in the study.
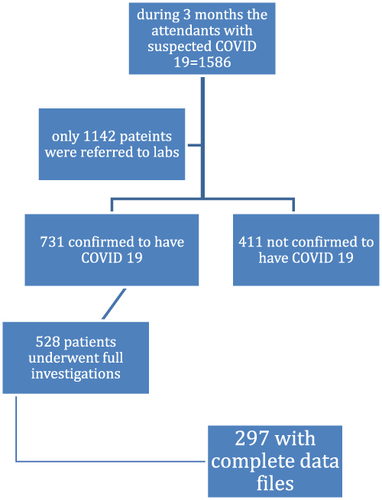
Table 1 Patients Distribution Regarding Their Baseline Demographic Characteristics
Table 2 Patients Distribution Regarding Their Baseline Clinical Presentations
Table 3 Patients Distribution Regarding Their Laboratory Investigations
Table 4 Pulmonary Embolism’s Risk Stratification in Affected Patients
Table 5 Multivariable Binary Logistic Regression Analysis for the Prediction of Pulmonary Embolism from Different Patients’ Characteristics
Table 6 Cut off, Sensitivity, Specificity, Positive Predictive Value, and Negative Predictive Value of Different Laboratory Parameters Associated with Pulmonary Embolism Occurrence
Table 7 Cut off, Sensitivity, Specificity, Positive Predictive Value, and Negative Predictive Value of Body Mass Index and Duration of Latency Till Seeking Medical Consultation Associated with Pulmonary Embolism Occurrence
Data Sharing Statement
The datasets used and/or analyzed during the current study are available from the corresponding author upon reasonable request.