Figures & data
Table 1 Demographic and clinical characteristics of the 344 subjects of the study population
Figure 1 Prevalence of major cardiovascular risk factors in the 344 subjects of the study.
Abbreviation: HDL, high density lipoprotein.
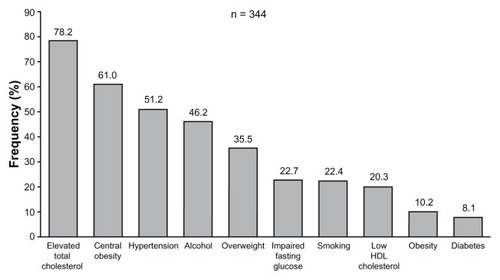
Figure 2 Prevalence (open bars), awareness (striped bars), and lack of awareness (full bars) of hypertension, hypercholesterolemia or diabetes in the 344 subjects of the study (A). Rates of treated (open bars) and of treated and controlled subjects (full bars) are shown in (B).
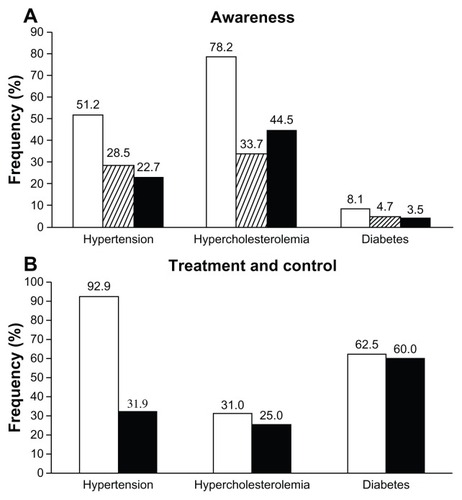
Figure 3 Mean values ± SD for BMI, waist circumference, S and D blood pressure, total and HDL serum cholesterol and blood glucose in the 344 subjects of the study according to decades of age.
Abbreviations: BMI, body mass index; D, diastolic; HDL, high density lipoprotein; S, systolic; SD, standard deviation.
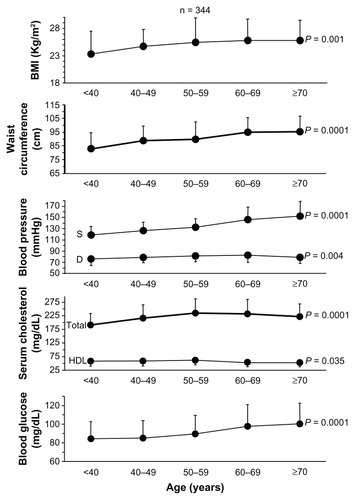
Table 2 Prevalence, treatment, and control of hypertension, hypercholesterolemia, and diabetes according to age and sex
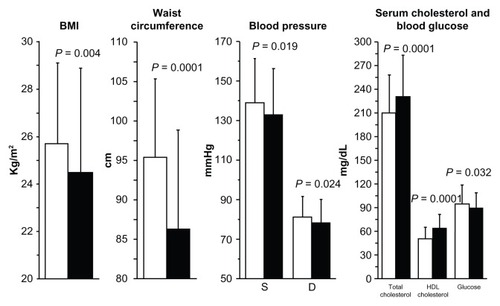
Figure 4 Mean values ± SD for BMI, waist circumference, S and D blood pressure, total and HDL serum cholesterol, and blood glucose in the 344 subjects of the study according to sex.
Abbreviations: BMI, body mass index; D, diastolic; HDL, high density lipoprotein; S, systolic; SD, standard deviation.