
Figures & data
Figure 1 Study flow diagram.
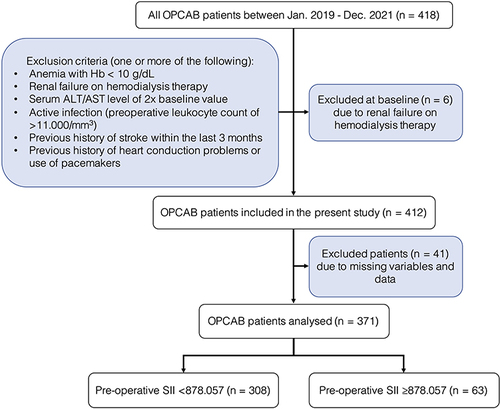
Table 1 Patients Characteristics
Table 2 Laboratory Parameters
Table 3 Procedural Data
Table 4 Perioperative Outcomes
Table 5 Analysis of High SII Values in Predicting Poor Perioperative Outcomes
Table 6 Correlation Between SII and Perioperative Outcomes
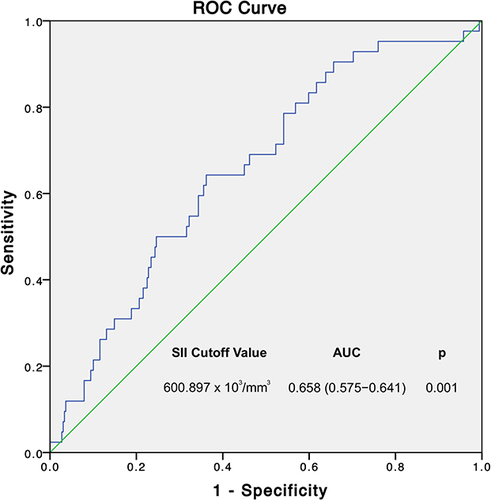
Figure 2 Receiver operating characteristic curve (ROC) for prediction of mechanical ventilation duration based on SII. AUC, area under curve; SII, systemic immune-inflammation index. The highest area under the curve of 0.658 (p = 0.001) for systemic immune-inflammation index, with its respective cutoff value of 600.897 x 10³/mm3.
Data Sharing Statement
Individual deidentified participant data from this study will be made available upon request after publication and will be available for 36 months following article publication. Researchers need to state their aims of analysis and provide a methodologically sound proposal directed towards the corresponding author.