
Figures & data
Figure 1 The inclusion process and the registered events after screening, at Oslo University Hospital.
Abbreviation: AD, aortic diameter.
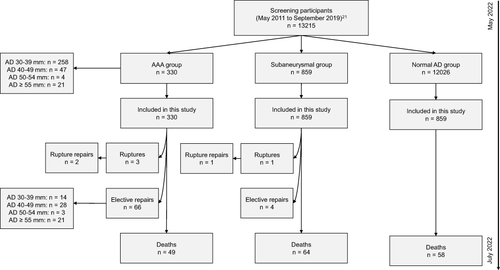
Table 1 Causes of Death for the Three Aortic Diameter Groups
Figure 2 Kaplan–Meier survival curves of the study population allocated to three groups according to aortic diameter upon screening: AAA, subaneurysmal- and normal aortic diameter. The latest censor date was 31 July 2022.
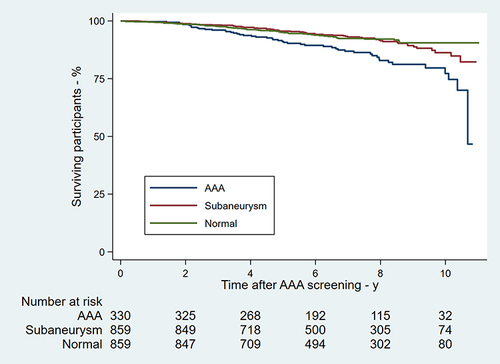
Table 2 Aortic Diameter Upon Repair and Aortic Growth Rate for Five Groups Defined by Aortic Diameter Upon Screening