Figures & data
Figure 1 Flowchart of patient selection showing the inclusion and exclusion criteria and final sample size.
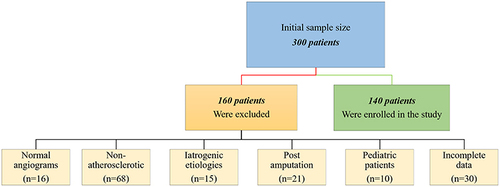
Figure 2 Annual prevalence of patients who were diagnosed with peripheral arterial disease at our hospital per 1000 people screened.
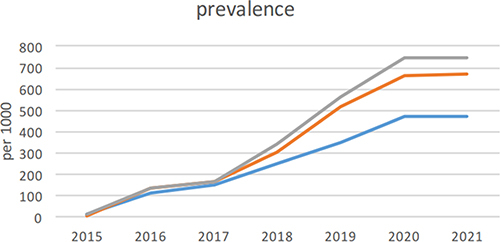
Table 1 Summary of Risk Factors and Related Comorbidities in Patients with Peripheral Arterial Disease
Figure 3 The pattern of PAD in a patient with diabetes. Maximal intensity projection image of lower limb CTA following contrast administration (a) with three-dimensional reformatted image over bony structures (b) demonstrates a moderate burden of atheromatous and atherosclerotic plaques causing multi-segmental stenoses predominantly at a proximal distribution of the lower extremity (arrowheads). However, below-knee vessels reveal a more extensive burden of PAD with segmental occlusions involving bilateral posterior tibial and peroneal arteries (arrows).
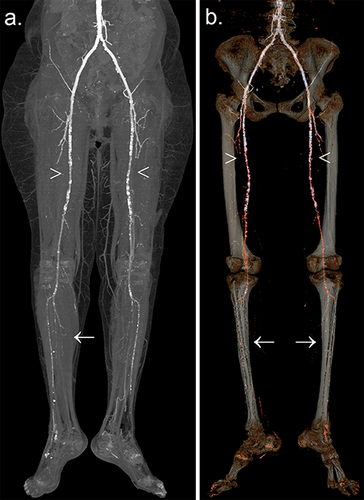
Figure 4 The pattern of PAD in a patient with renal failure. Following contrast administration, the maximal intensity projection image of lower limbs CTA demonstrates a moderate burden of atheromatous and atherosclerotic plaques causing multi-segmental stenoses predominantly in distal lower extremities (arrows). Furthermore, the pelvis harbors a looped peritoneal dialysis catheter denoting the status of dialysis dependency (asterisk).
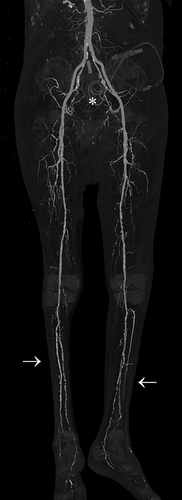
Figure 5 Pre- (a and b) and post-contrast (c) injection reveal the classic pattern of circumferential atherosclerosis with the so-called ring-shaped sign of calcific plaques (arrows) extending from the infrarenal abdominal aorta (a) to the common iliac arteries (b). Additionally, a portion of both kidneys (a) shows the classic imaging stigmata of nephropathy chronification, including intra-renal arteries atherosclerosis (arrowhead), polycystic changes (asterisk) denoting recurrent dialysis, loss of volume, and atrophied kidneys. Post-contrast CTA (c) shows patent iliac vessels despite extensive atherosclerosis (arrow).
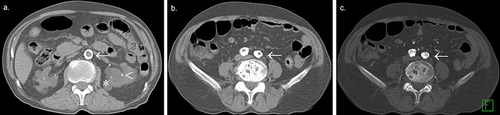
Table 2 Characterization of the Pattern and Severity of Peripheral Artery Disease and Sites of Involvement
Table 3 Independent Predictors Associated with Different Risk Factors and Comorbidities on Multivariate Analysis
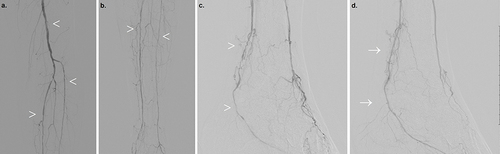
Figure 6 Right lower extremity angiography in a patient with diabetes. A sequential catheter-directed contrast injection depicting the pattern of PAD with exaggerated involvement of below-knee vessels in terms of tortuosity, multi-segmental narrowing, and chronification of collaterals (a–c) (arrowheads). (d) Post-angioplasty posterior tibial artery using a 2-mm non-compliant balloon with resultant improved flow, resolved narrowing, and instant reduction of collaterals (arrow).