
Figures & data
Table 1 Distribution of Important Socio-Demographic and Clinical Characteristics of Hypertensive Patients Follow-up at DebreTabor Hospital
Figure 1 Kaplan–Meier survival estimates of different groups of hypertensive patients at DebreTabor Hospital, Ethiopia.
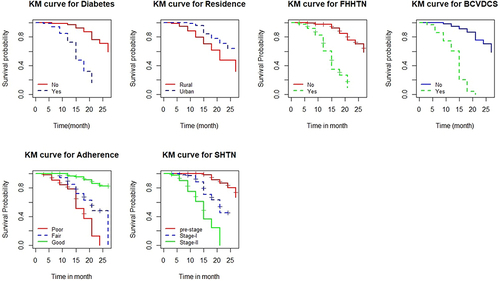
Table 2 Results of the Log Rank Test for the Significant Categorical Variables of HTN Patients Follow-up at DebreTabor Hospital
Table 3 Results of Proportionality Assumption for the Significant Categorical Variables of HTN Patients Follow-up at DebreTabor Hospital
Figure 2 Schonfildes residual plot for significant categorical variables of HTN patients follow-up at DebreTabor Hospital.
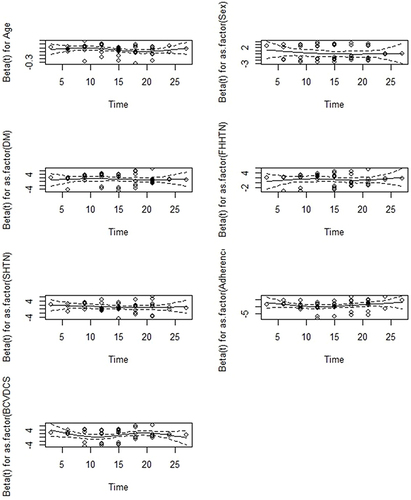
Table 4 Cox Proportional Hazards Regression Analysis of Time to CVDC of Hypertensive Patients Follow-up at DebreTabor Hospital
Figure 3 Individual and mean profile plots of the SBP and DBP of HTN patients.
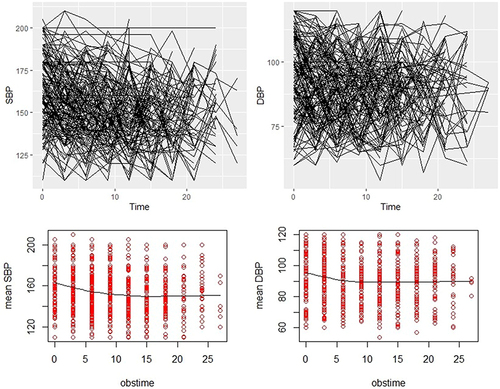
Figure 4 Average trend line of SBP, and DBP over time with cardiovascular disease complication status at DebreTabor Hospital, Ethiopia.
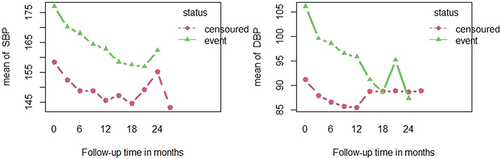
Table 5 Bivariate Random Mixed-Effects Model for SBP and DBP of HTN Outpatients Follow-up at Debre Tabor Hospital, Ethiopia
Table 6 Joint Model of Longitudinal SBP & DBP with Survival Time to Cardiovascular Disease Complication