Figures & data
Table 1 Patient Characteristics Study Population
Figure 1 Distribution of CAC score per clinical symptom category based on the 2019 ESC guideline on chronic coronary syndromes: non-anginal chest pain, atypical angina, typical angina or dyspnea.
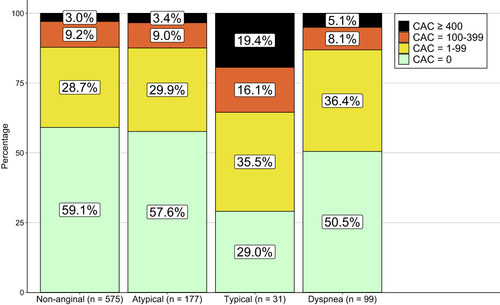
Figure 2 Distribution of CAC scores across PTP for CAD categories.
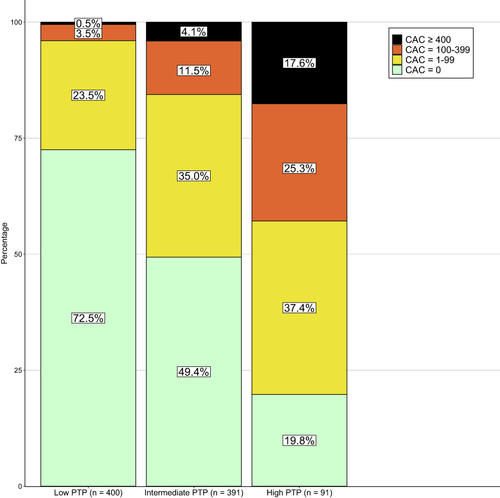
Table 2 Characteristics of Patients with CAC Score of 0 and CAC Score > 0
Table 3 Association Between Number of Risk Factors and Elevated CAC Score (CAC Score > 0)
Figure 3 Results of CAC scores compared to results of exercise ECG. For each exercise ECG result (normal, abnormal, inconclusive) we showed the distribution of CAC scores.
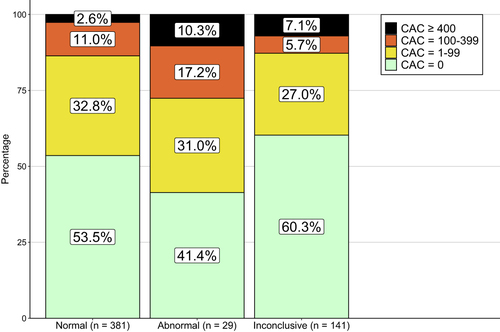
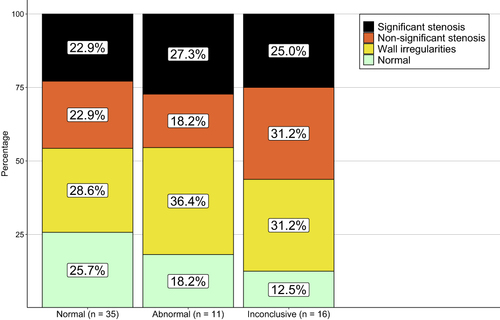
Figure 4 Results of coronary angiography compared with results of CAC score. For each CAC score result (CAC score = 1–99, CAC score = 100–399, CAC score ≥ 400) the distribution of results of coronary angiography is shown.

Figure 5 Results of coronary angiography compared with results of exercise ECG. For each exercise ECG result (normal, abnormal, inconclusive) the distribution of results of coronary angiography is shown.