
Figures & data
Figure 1 Standardized incidence rate by technique (A) and Sankey plot visualizing the distribution of techniques used for vascular repair between 90 days and 5 years following primary revascularization (B).
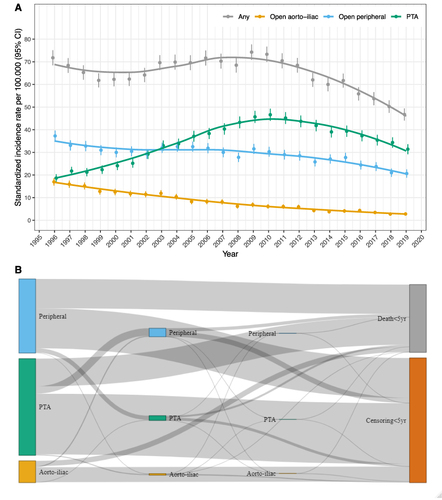
Figure 2 Incidence rate of primary vascular repair for lower extremity artery disease.
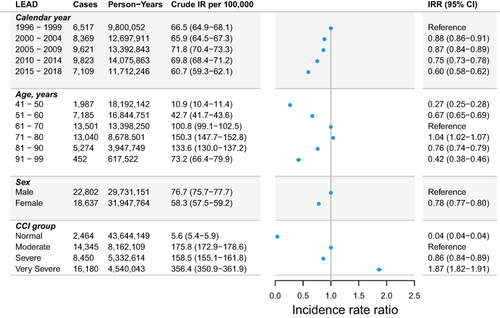
Figure 3 Sex specific incidence rate in repair for lower extremity artery disease.
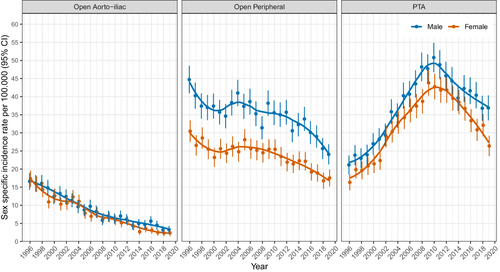
Figure 4 Indication specific standardized incidence rate in repair for lower extremity artery.
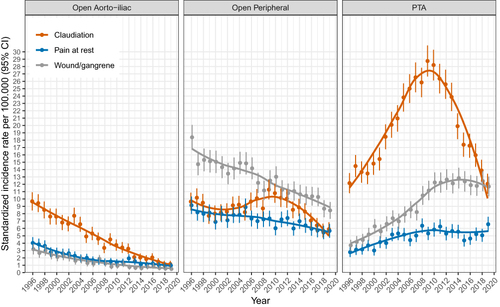
Table 1 Baseline Characteristics of Patients Undergoing Surgery for Lower Extremity Artery Disease in Denmark 1996–2018
Figure 5 Age trend in Charlson’s comorbidity index score relative to age group 71–75 by population.
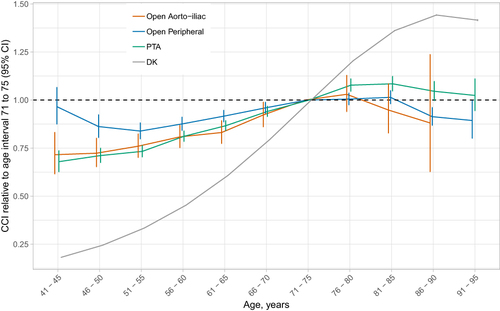
Table 2 Five-Year Mortality Following LEAD Surgery in Denmark 1996–2018