Figures & data
Table 1 Patients’ Baseline Characteristics and Associated Comorbid Conditions
Table 2 The Presenting Signs and Symptoms of the Studied Sample
Figure 1 Distribution of intraluminal thrombus in the extracranial arteries. The most common location of ILT was ICA followed by the aortic arch. Reproduced with permission from Yazan Alghammas as this figure has been drawn specifically for this research project.
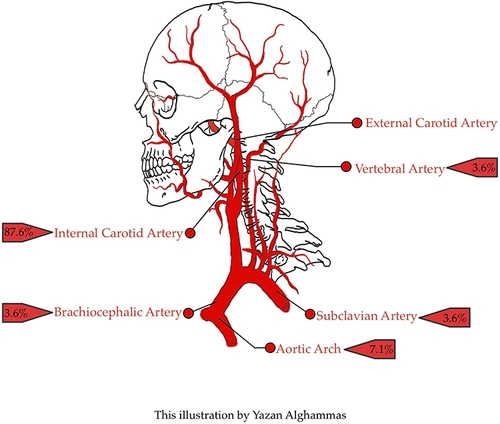
Table 3 Treatment Offered to the Patients at Different Time Intervals
Table 4 Safety Outcomes Based on Treatment Group
Table 5 Efficacy Outcomes Based on NIHSS at Different Time Intervals
Table 6 Efficacy Outcomes Based on Follow-Up Repeat Scans
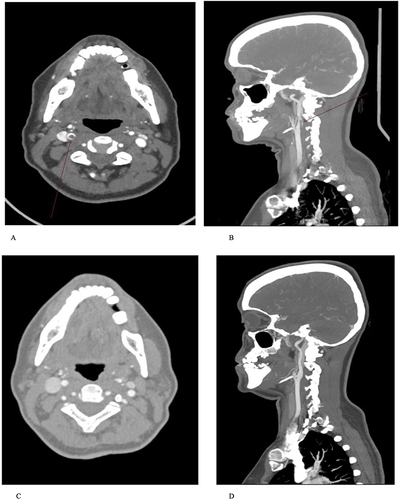
Figure 2 (A and B) computed tomography angiography of 51 years old female with ILT of ICA. (C and D) Follow-up computed tomography angiography of the same patient within 3 months shows complete resolution of the thrombus after starting medical treatments.