Figures & data
Figure 1 Schematic block diagram of a photoplethysmograph system for the human finger.
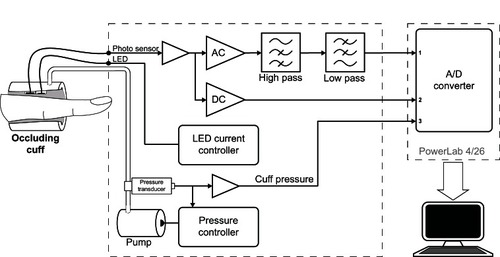
Figure 2 Example of the recorded output signals from the photoplethysmograph: the alternating current (AC), direct current (DC), and cuff-pressure (Pc) signals are shown.
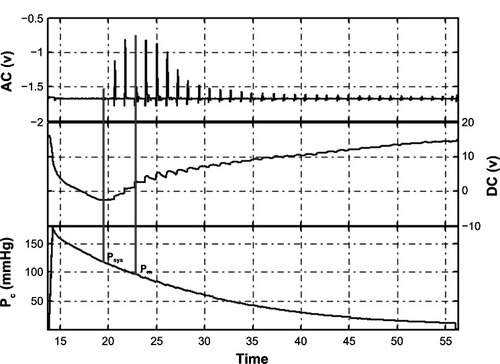
Figure 3 Relationships between the transmural pressure (Ptr) and the relative volume difference (ΔV/ΔV0) in subjects with moderately sized fingers according to the occluding cuff size: 20 mm (♦), 22 mm (■), and 24 mm (▲) diameter cuffs.
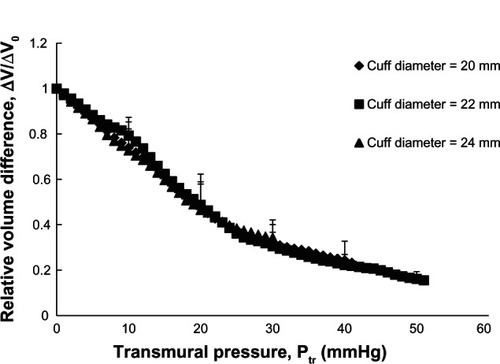
Figure 4 Relationships between the transmural pressure (Ptr) and the relative volume difference (ΔV/ΔV0) in subjects with large fingers according to the occluding cuff size: 20 mm (♦), 22 mm (■) and 24 mm (▲) diameter cuffs.
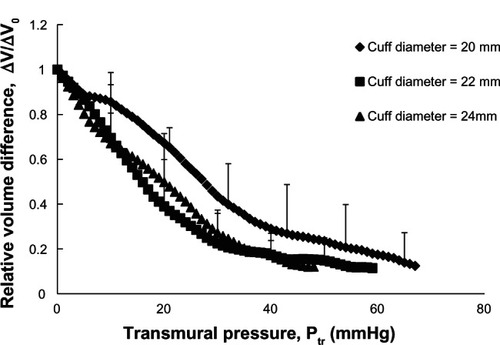
Figure 5 Average mean blood pressure (Pm), pulse pressure (ΔP), and heart rate in six groups of subjects (eight women and eight men, 20–25 years old; five women and five men, 32–45 years old; and six women and six men, over 50 years old) presented in five subfigures: (A) average Pm in the brachial (filled bars), and digital (open bars) arteries; (B) average ΔP in the brachial (filled bars), and digital (open bars) arteries; (C) average Pm (open bars), and ΔP (filled bars) in the brachial artery; (D) average Pm (open bars), and ΔP (filled bars) in the digital artery; and (E) average heart rate (filled bars).
Abbreviations: M, men; W, women.
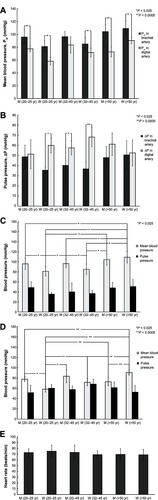
Figure 6 Positive correlation between mean blood pressure (Pm) and age.
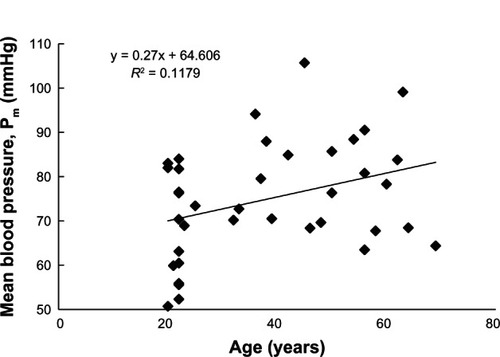
Figure 7 Relationships between transmural pressure (Ptr) and relative volume difference (ΔV/ΔV0) in arterial elasticity analyses performed in six groups of subjects: eight women (○) and eight men (●), 20–25 years old; five women (△) and five men (A), 32–45 years old; and six women (□) and six men (■), over 50 years old.
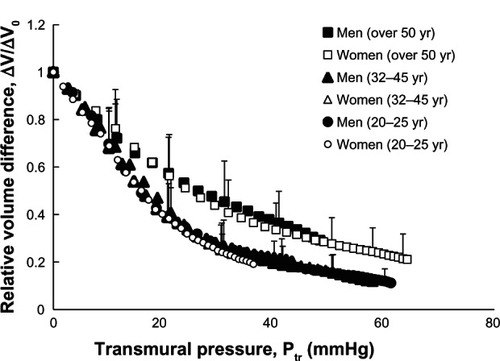
Figure 8 Relative volume differences (ΔV/ΔV0) at a transmural pressure (Ptr) of 30 mmHg in six groups of subjects: eight women and eight men, 20–25 years old; five women and five men, 32–45 years old; and six women and six men, over 50 years old.
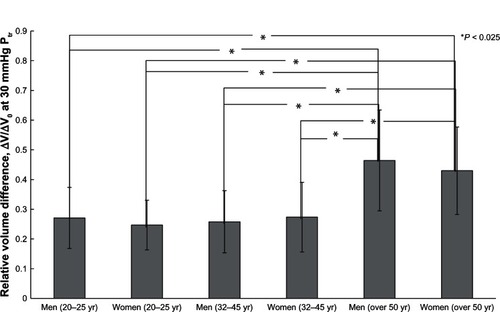
Figure 9 Positive correlation between the mean relative volume difference (ΔV/ΔV0) value at a transmural pressure (Ptr) of 30 mmHg and age.
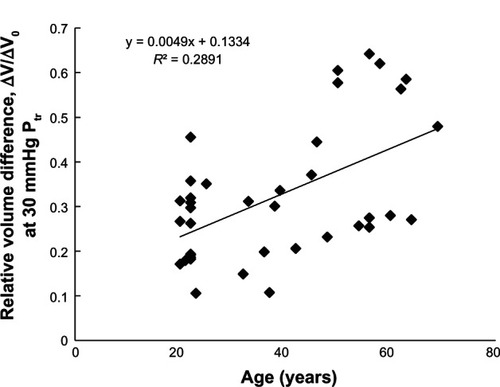
Figure 10 Average mean blood pressure (Pm), pulse pressure (ΔP), and heart rate in twelve subjects according to the three conditions: pre-cold-stress stimulation (Pre-CSS), cold stress stimulation (CSS), and post-cold-stress stimulation (Post-CSS) presented in five subfigures: (A) average Pm in the brachial (filled bars), and digital (open bars) arteries; (B) average ΔP in the brachial (filled bars), and digital (open bars) arteries; (C) average Pm (open bars), and ΔP (filled bars) in the brachial artery; (D) average Pm (open bars), and ΔP (filled bars) in the digital artery; and (E) average heart rate (filled bars).
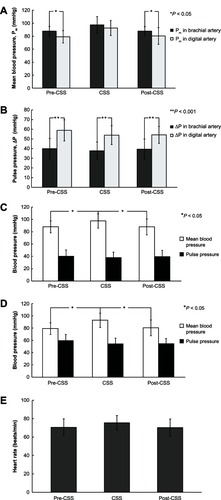
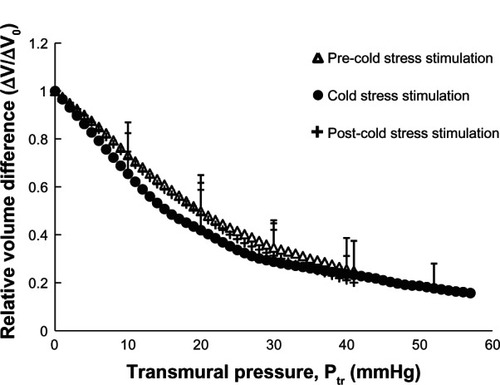
Figure 11 Relationships between transmural pressure (Ptr) and the relative volume difference (ΔV/ΔV0) according to the effect of cold-stress stimulation separated into three conditions: pre-cold-stress stimulation (Δ), cold-stress stimulation (●), and post-cold-stress stimulation (+).