Figures & data
Table 1 Characteristics of the Study Group
Figure 1 Definition of the IRmax, HRmax, and RHR parameters (A). An exemplary FMSF trace with a negative ischemic response (IRmax < 0) recorded for a cardiac patient (male, 71 y, ischemic heart disease, hypertension) (B).
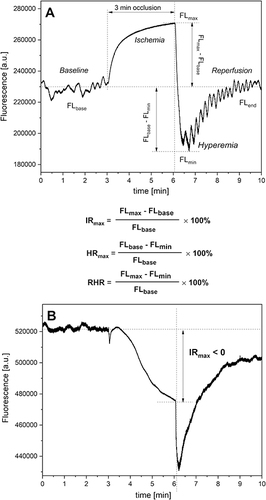
Figure 2 Comparison of the IRmax (A) parameter in groups by sex (female: n=163, mean age 70.0; male: n=157, mean age 68.3). Comparison of the HRmax (B) and RHR (C) parameters in groups by sex (female: n=264, mean age 70.4; male: n=218, mean age 68.1).
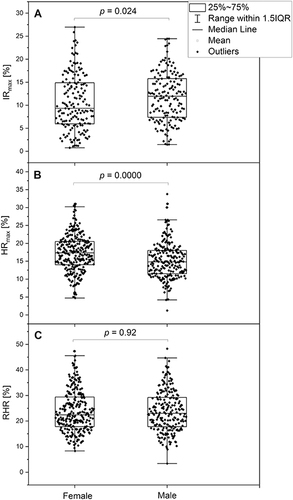
Table 2 Characteristics of the Groups by Age with Values of the Main FMFS Parameters
Figure 3 Assessment of IRmax (A) and HRmax (B) parameters in groups by age, expressed as means and standard deviations (groups by age: 40–59 y: n=82, 41f + 41m, mean age 52.2; 60–69 y: n=155, 80f + 75m, mean age 65.4; 70–79 y: n=169, 94f + 75m, mean age 74.0; 80–94 y: n=79, 50f + 29m, mean age 84.9).
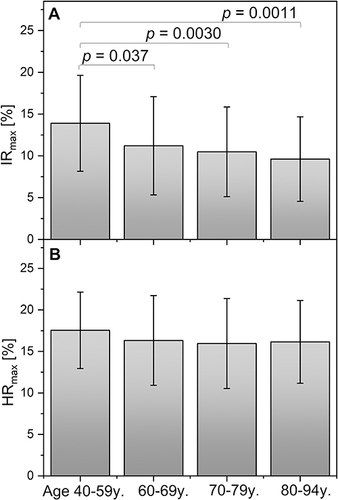
Table 3 Characteristics of the Groups by Ischemic Response
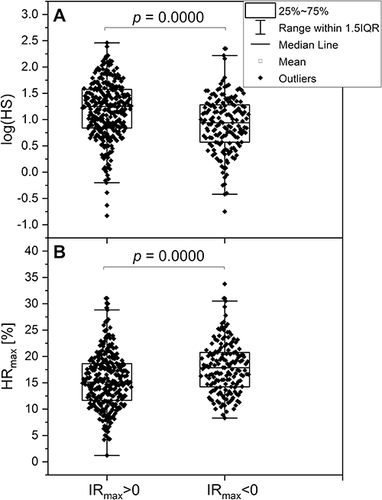
Figure 4 Comparison of the log(HS) (A) and HRmax (B) parameters in the groups by ischemic response (IRmax > 0: n=320, mean age 69.2; IRmax < 0: n=162, mean age 69.7).