
Figures & data
Figure 1 Shows how each cross-section can be divided into four quadrants.
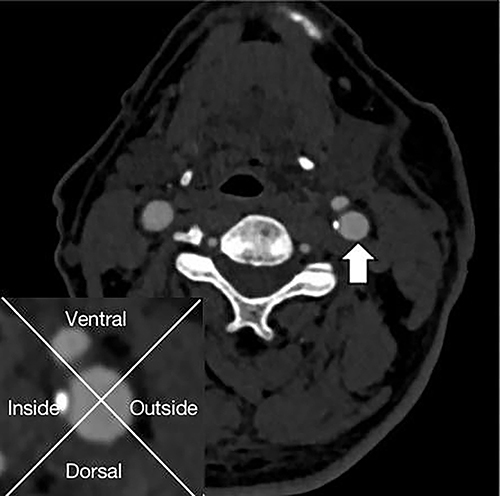
Figure 2 (a) Plaque ulcers; (b) Napkin ring sign; (c) Point calcification.
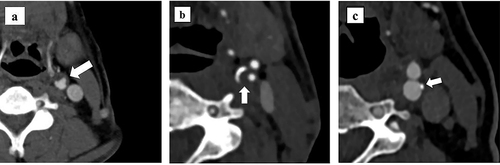
Table 1 Comparison of Patients’ Clinical Characteristics Between Two Groups of High and Low-Risk Plaques
Figure 3 Case screening flow chart.
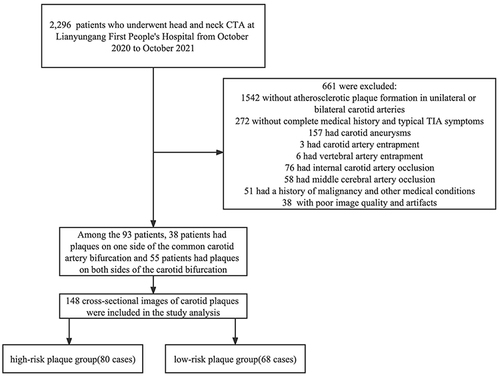
Table 2 Differences in the Distribution Location and Characteristics Between Two Groups of High and Low-Risk Plaques (n, %)
Table 3 Diagnostic Value of CTA Examination-Related Indicators for Vulnerability of Dorsal Side Wall Plaques
Figure 4 Shows the average CT values of plaques with different distribution locations in the high-risk plaque group, Error bars represent the mean with SEM (standard error of mean) of the four data sets. There was no statistical significance was analyzed using two-way ANOVA, (P>0.05).
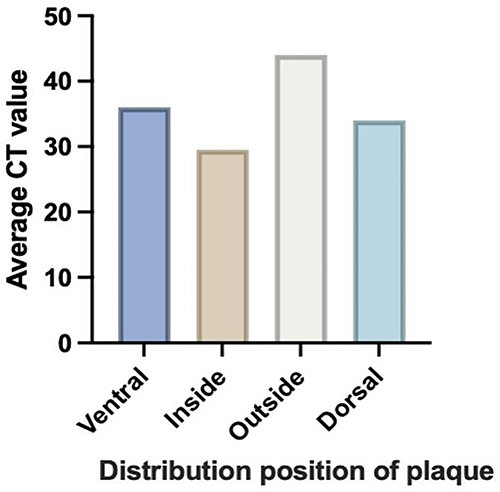
Table 4 Logistic Regression Analysis of the Correlation of Distribution Location, T, L, PA with Vulnerability of Plaques