
Figures & data
Figure 1 Flow chart showing a selection of patients diagnosed with acute ischemic stroke in two hospitals from November 2018 to November 2021.
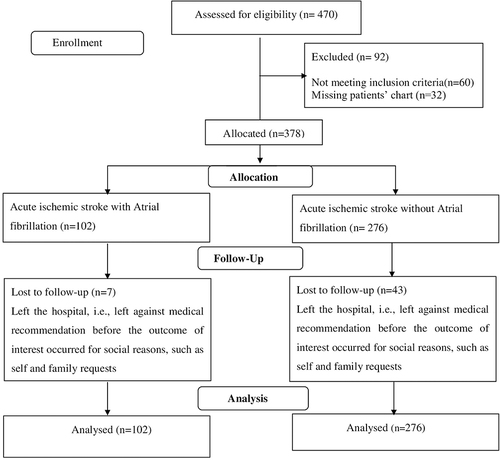
Figure 2 Kaplan-Meier estimate of survival rates in patients with atrial fibrillation and patients without atrial fibrillation.
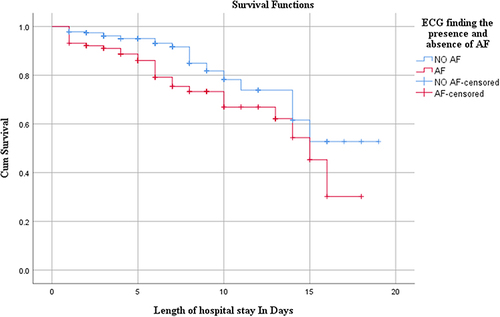
Table 1 Socio-Demographic Characteristics of Patients Diagnosed with AIS from FHSCH and TGSCH from November 2018 to November 2021 (n=378)
Table 2 Baseline Characteristics of Acute Ischemic Stroke Patients with Atrial Fibrillation and Those Without Atrial Fibrillation (n=378)
Table 3 Comparison of Neurologic Deficits During Admission Among Patients with Acute Ischemic Stroke Patients Plus Atrial Fibrillation and Those without Atrial Fibrillation
Table 4 In-Hospital Treatment Prescribed of Patients with Acute Ischemic Stroke Plus Atrial Fibrillation and without Atrial Fibrillation
Table 5 Stroke-Related Complications During Hospital Stay in a Patient with Acute Ischemic Stroke Plus Atrial Fibrillation and without Atrial Fibrillation
Table 6 Bivariate and Multivariate Cox-Regression Analysis Results to Predictors Contributing to Survival of Acute Ischemic Stroke Patients with Atrial Fibrillation and Those without Atrial Fibrillation (n=378)