Figures & data
Figure 1 (A and B) Non-contrast cranial CT showed multiple hyperdense venous hemorrhages in the right frontal lobe with surrounding extensive hypodense vasogenic edema.
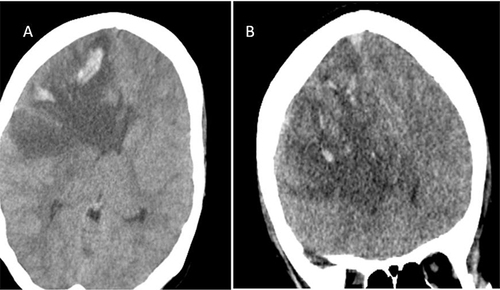
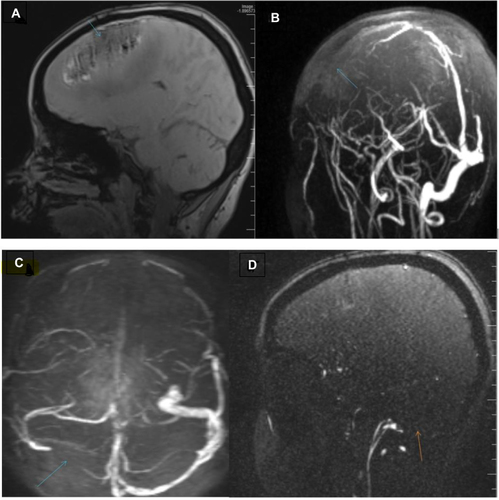
Figure 2 (A and B) MR venogram showing large filling defects area in the anterior aspect of the superior sagittal sinus representing thrombosis and associated right frontoparietal lobes cortical-subcortical areas heterogenous lesion corresponding venous hemorrhagic infarct (green arrow). (C and D) MR venogram (TOF) Shows filling defect in the right transverse sinus indicating thrombosis (green and Orange arrows).