Figures & data
Figure 1 The Omron HEM-1026 (HCR-1901T2/HCR-1902T2).
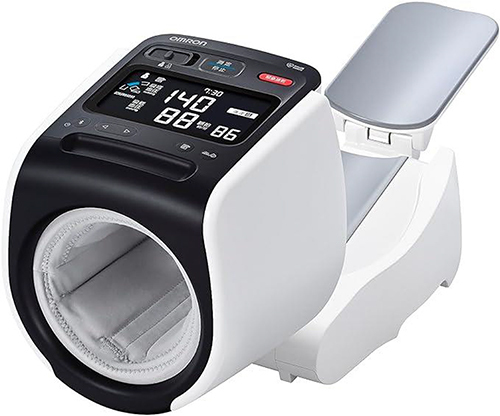
Table 1 Screening and Recruitment Details
Table 2 Baseline Characteristics of the Subjects
Table 3 Blood Pressure Distribution
Table 4 Validation Results
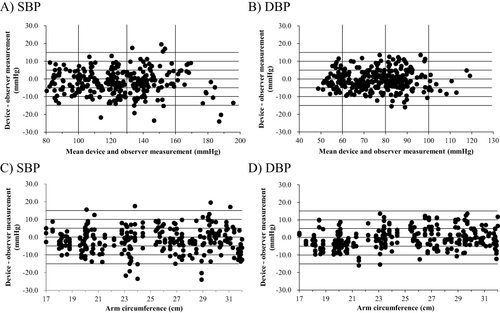
Figure 2 The upper panels depict the Bland-Altman plots of the differences between the Omron HEM-1026 (HCR-1901T2/HCR-1902T2) readings and the observer measurements for (A) systolic blood pressure (SBP) and (B) diastolic blood pressure (DBP). The lower panels are scattergrams showing the relationship between arm circumference and differences between Omron HEM-1026 (HCR-1901T2/HCR-1902T2) readings and observer measurements for (C) systolic blood pressure (SBP) and (D) diastolic blood pressure (DBP).