Figures & data
Figure 1 Regression of triglycerides on the log of the rate ratio for (A) all trials, (B) primary prevention trials, and (C) secondary prevention trials. Each panel shows the output from regression analysis in Comprehensive Meta-Analysis.
Notes: (A) 40 trials, slope =0.488, P=0.005; (B) 11 trials, slope =1.031, P=0.010; (C) 25 trials, slope =0.373, P=0.114.
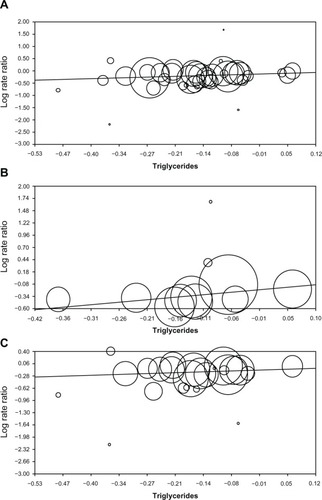
Table 1 Statistics for the regression analyses of lipid values versus cardiovascular eventsTable Footnotea
Table S1 Clinical trials included in the analysis