Figures & data
Figure 1 Flow of PA and non-PA patients through the CRUCIAL trial.
Abbreviations: AE, adverse event; CHD, coronary heart disease; CHF, congestive heart failure; CRUCIAL, Cluster Randomized Usual Care versus Caduet Investigation Assessing Long-term-risk; CV, cardiovascular; DBP, diastolic blood pressure; HbA1c, glycated hemoglobin; PA, Pacific Asian; PMI, proactive multifactorial intervention; SBP, systolic blood pressure; TC, total cholesterol; TG, triglycerides; TIA, transient ischemic attack; UC, usual care.
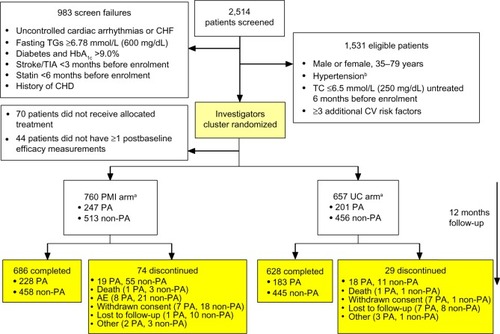
Table 1 Baseline characteristics and demographics in PA and non-PA regions
Table 2 Distribution of SPAA dose at week 52 by subgroup
Figure 2 Relative percentage change in Framingham 10-year CHD risk, from baseline to week 52 for PA and non-PA patients by treatment arm.
Abbreviations: CHD, coronary heart disease; CI, confidence interval; LS, least square mean for difference; PA, Pacific Asian; PMI, proactive multifactorial intervention; UC, usual care.
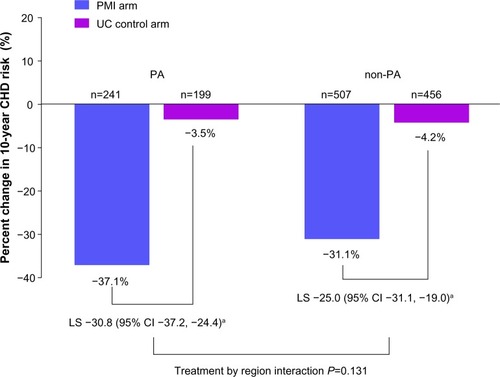
Figure 3 Adjusted mean change from baseline to week 52 in (A) SBP and DBP (mmHg), and (B) TC and LDL-C (%) for PA and non-PA patients.
Abbreviations: CI, confidence interval; DBP, diastolic blood pressure; LDL-C, low-density lipoprotein cholesterol; LS, least square mean for difference; PA, Pacific Asian; PMI, proactive multifactorial intervention; SBP, systolic blood pressure; TC, total cholesterol; UC, usual care.
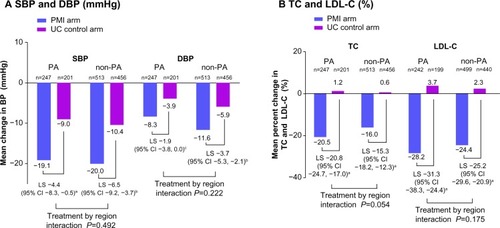
Figure 4 Study-specific BP and LDL-C goal attainment at week 52 for PA and non-PA patients.
Abbreviations: BP, blood pressure; CI, confidence interval; LDL-C, low-density lipoprotein cholesterol; OR, odds ratio; PA, Pacific Asian; PMI, proactive multifactorial intervention; UC, usual care.
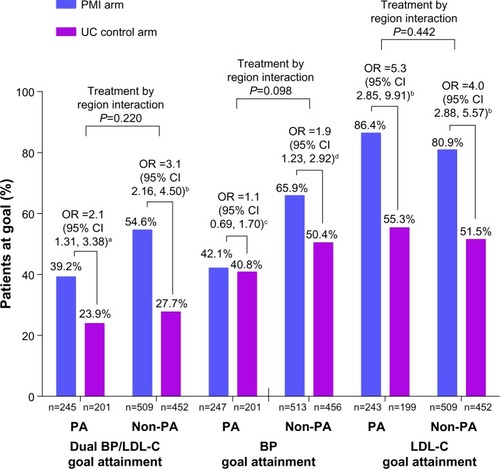
Table 3 All-causality AEs in PA and non-PA patients
Figure 5 Treatment effect on efficacy measures from baseline to week 52 for men and women in the (A) PA region, and (B) non-PA region.
Abbreviations: CHD, coronary heart disease; CI, confidence interval; LS, least square; PA, Pacific Asian; PMI, proactive multifactorial intervention; UC, usual care.
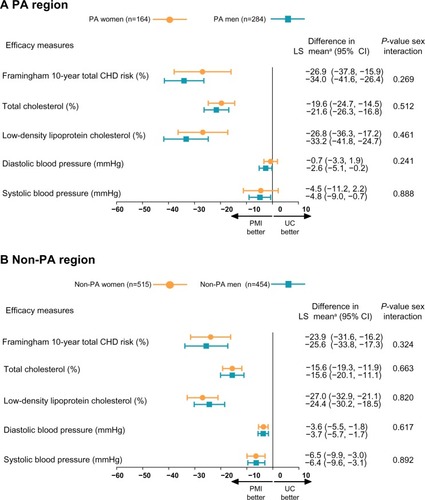
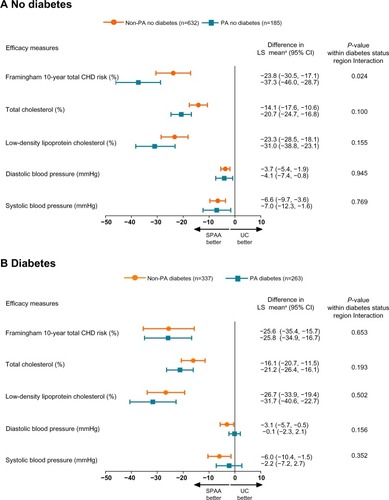
Figure 6 Treatment effect on efficacy measures from baseline to week 52 for PA and non-PA patients with (A) no diabetes, and (B) diabetes.
Abbreviations: CHD, coronary heart disease; CI, confidence interval; LS, least square; PA, Pacific Asian; SPAA, single-pill amlodipine/atorvastatin; UC, usual care.