
Figures & data
Figure 1 Study design.
Abbreviations: LDL-C, low-density lipoprotein cholesterol; Rx, prescription.
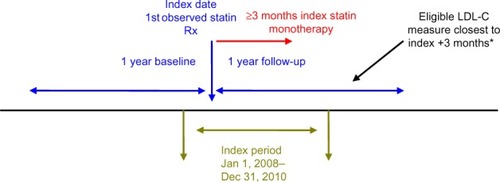
Figure 2 Patient accrual.
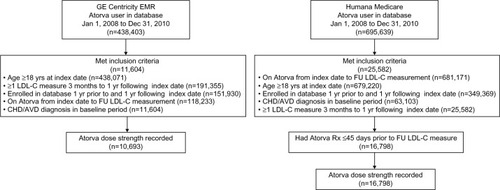
Table 1 Patient characteristics
Table 2 Follow-up LDL-C levels by atorvastatin dose
Figure 3 Distribution of LDL-C levels around <1.8 mmol/L (<70 mg/dL) and <2.6 mmol/L (<100 mg/dL) cut points.
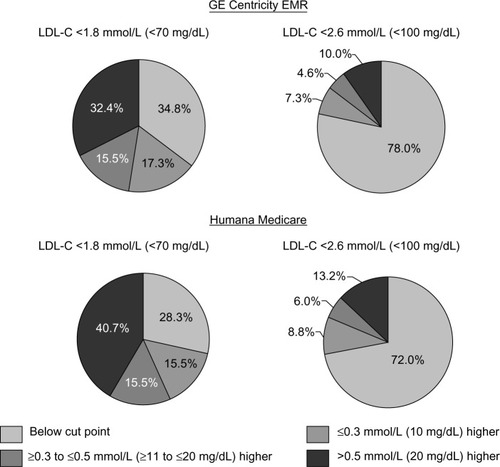
Figure 4 Proportion of patients with LDL-C <1.8 mmol/L (<70 mg/dL) and <2.6 mmol/L (<100 mg/dL) by atorvastatin dose.
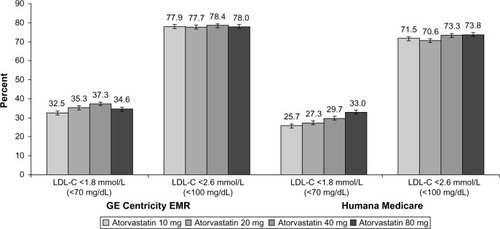
Table S1 Diagnosis and procedure codes used to identify patients
Table S2 GE Centricity EMR: proportion of patients with LDL-C <1.8 mmol/L (<70 mg/dL) and proportion with levels >1.8 mmol/L (>70 mg/dL), categorized by distance from goal
Table S3 GE Centricity EMR: proportion of patients with LDL-C <2.6 mmol/L (<100 mg/dL) and proportion with levels >2.6 mmol/L (>100 mg/dL), categorized by distance from goal
Table S4 Humana Medicare: proportion of patients with LDL-C <1.8 mmol/L (<70 100 mg/dL) and proportion with levels >1.8 mmol/L (>70 mg/dL) categorized by distance from goal
Table S5 Humana Medicare: proportion of patients with LDL-C <2.6 mmol/L (<100 mg/dL) and proportion with levels >2.6 mmol/L (>100 mg/dL), categorized by distance from goal