Figures & data
Table 1 The baseline characteristics of the examined patients, n=137
Figure 1 The PTIN calculation principle.
Notes: T1, T2 and Tn are the periods in which the PWV does not exceed the cutoff value of 10 m/second. PTIN, % = (T1 + T2 +… + Tn)/Tm ×100, where Tm is the entire period of monitoring, Pulse Time index of norm.Citation2,Citation22
Abbreviations: PTIN, Pulse Time Index of Norm; PWV, pulse wave velocity.
Abbreviations: PTIN, Pulse Time Index of Norm; PWV, pulse wave velocity.
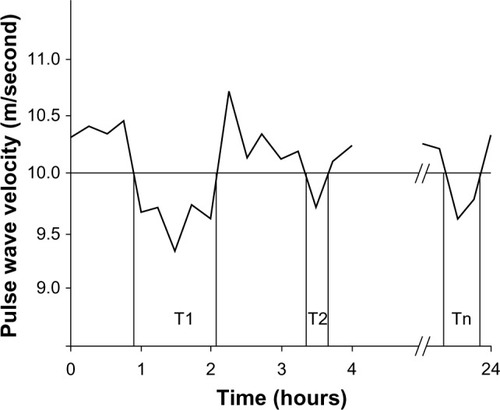
Figure 2 Histogram of PTIN distribution – observed frequencies and expected normal curve.
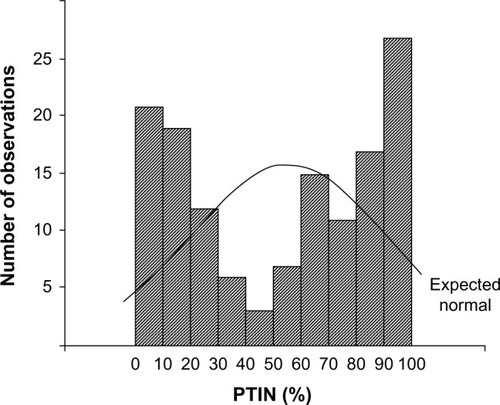
Figure 3 Correlation between the LVMI (g/m2) and: (A) the PTIN (%), (B) the SBP load (%), and (C) the DBP load (%).
Notes: Pulse Time Index of norm.Citation2,Citation22
Abbreviations: DBP, diastolic blood pressure; SBP, systolic blood pressure; LVMI, left ventricular mass index; PTIN, Pulse Time Index of Norm.
Abbreviations: DBP, diastolic blood pressure; SBP, systolic blood pressure; LVMI, left ventricular mass index; PTIN, Pulse Time Index of Norm.
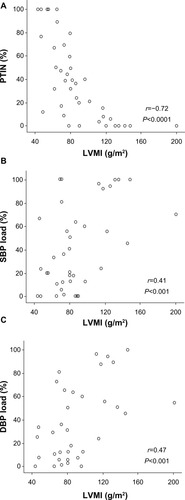
Table 2 The correlations between the echocardiographic data and the BPLab Vasotens® (Petr Telegin company, Nizhny Novgorod, Russian Federation) indices
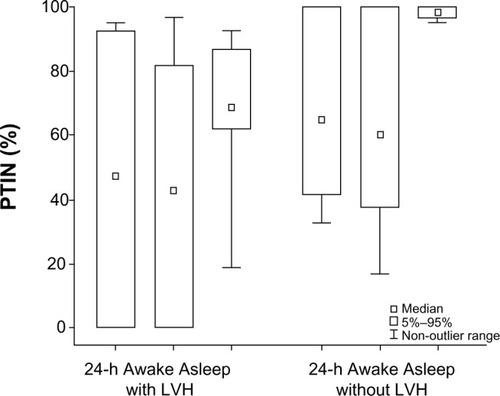
Figure 4 Medians, limits of the fifth and 95th percentiles and non-outlier range of PTIN according to 24-hour awake and asleep periods in patients with and without LVH.
Notes: Pulse Time Index of norm.Citation2,Citation22
Abbreviations: LVH, left ventricular hypertrophy; PTIN, Pulse Time Index of Norm; h, hour.
Abbreviations: LVH, left ventricular hypertrophy; PTIN, Pulse Time Index of Norm; h, hour.