
Figures & data
Figure 1 Study selection flow chart.
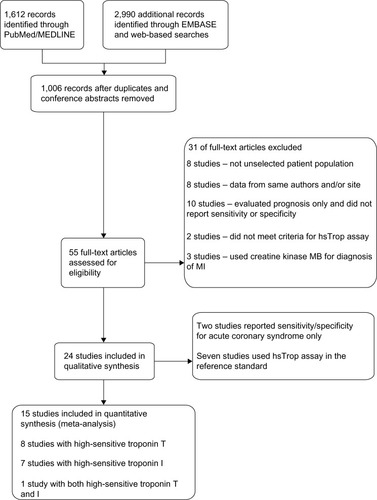
Figure 2 Forest plots showing pooled sensitivities and specificities.
Abbreviation: CI, confidence interval.
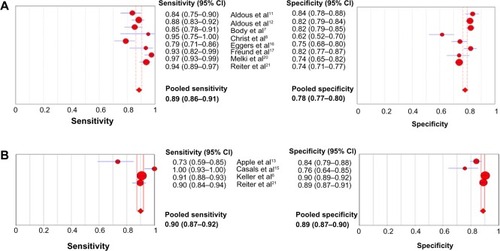
Table 1 (A) Pooled estimates of diagnostic accuracy for myocardial infarction of studies included in primary analysis; (B) results of meta-regression analysis of study level covariates on diagnostic odds ratio
Figure 3 Summary receiver operating plots: (A) conventional troponin, (B) sensitive/high-sensitive troponin at 99th percentile cut-off, and (C) high-sensitive troponin at the level of detection.
Abbreviations: AUC, area under the curve; SE, standard error; SROC, summary receiver operating curve.
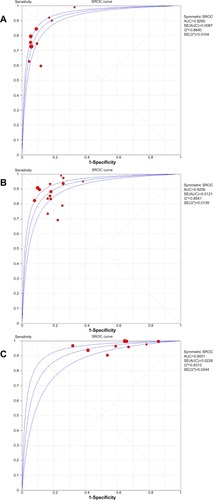
Figure 4 Forest plot showing pooled sensitivities and specificities for high-sensitive troponin T (Hoffman-La Roche Ltd) when high-sensitive troponin T assays were used in the reference standard.
Abbreviation: CI, confidence interval.
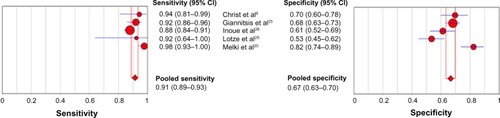
Figure S1 Summary plot of individual studies reporting sensitivity and specificity for high-sensitive troponin assays at presentation for acute coronary syndrome.
Abbreviations: CI, confidence interval; FN, false negative; FP, false positive; TN, true negative; TP, true positive.
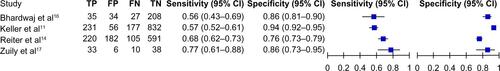
Figure S2 QUADAS analysis of methodological quality of included studies.
Abbreviation: QUADAS, Quality Assessment tool for Diagnostic Accuracy Studies.
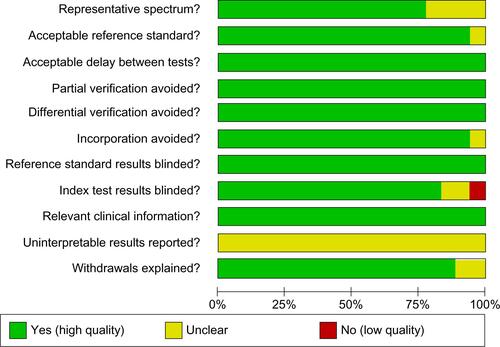
Table S1 Characteristics of studies reporting diagnostic accuracy of high-sensitive troponin assays using conventional troponin in the reference standard
Table S2 Characteristics of studies reporting diagnostic accuracy of high-sensitive troponin assays using high-sensitive troponin in the reference standard