Figures & data
Figure 1 The coronary pressure–flow relationship.
Notes: Coronary blood flow at rest (solid line) is controlled by autoregulation and metabolic adaptation in order to maintain blood flow at a level that meets myocardial demand. During coronary hyperemia, autoregulatory control is exhausted and blood flow depends on perfusion pressure. The coronary pressure–flow relationship is concave at low perfusion pressures. The zero-flow intercept on the pressure axis (Pzf) slightly exceeds venous pressure (Pv). Straight extrapolation of the hyperemic pressure–flow relationship results in an incremental linear relationship that intercepts the pressure axis at the coronary wedge pressure (Pw). Small vessel disease or abnormal left ventricular function decreases the slope of the hyperemic pressure–flow relationship, whereas elevated left ventricular end-diastolic pressure or left ventricular hypertrophy cause a parallel shift of the hyperemic pressure–flow relationship to the right.
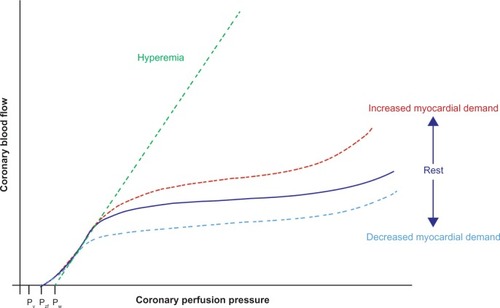
Figure 2 Resistance model of the coronary circulation.
Notes: The pressure gradient across a stenosis is determined by the sum of the stenosis’ friction and exit losses. Friction losses are linearly related to the flow through the stenosis, whereas exit losses increase with the square of flow, resulting in a unique curvilinear relation between pressure gradient and flow velocity for a given stenosis geometry. Measurement of intracoronary physiology includes proximal perfusion pressure (Paorta), coronary pressure and flow velocity distal of the stenosis (Pdistal and v, respectively), and the venous back pressure (Pback) that is usually assumed to be minimal. The relationship between blood flow through the stenosis and the resulting pressure drop is described by the quadratic equation ΔP = Av + Bv2, where ΔP is the pressure drop across the stenosis, v is flow velocity, and the coefficients A and B are a function of stenosis geometry and rheological properties of blood.
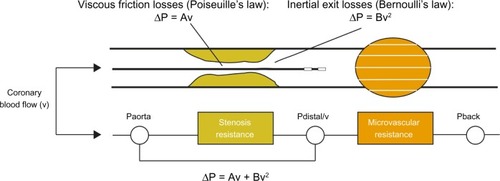
Figure 3 Pressure gradient–flow velocity relationship.
Notes: Pressure loss over an epicardial vessel without a stenosis is negligible, and therefore increases linearly with flow across the stenosis (reference vessel). With increasing stenosis severity (increasing stenosis severity from stenosis A to stenosis C), the pressure gradient–flow velocity (ΔP-v) curve becomes steeper, reflecting incremental loss of perfusion pressure over the stenosis with increasing flow velocity with increasing stenosis severity. This ΔP-v curve, the fingerprint of a given stenosis, is described by the quadratic equation ΔP = Av + Bv2, where ΔP is the pressure drop across the stenosis, v is flow velocity, and the coefficients A and B are a function of stenosis geometry and rheological properties of blood.
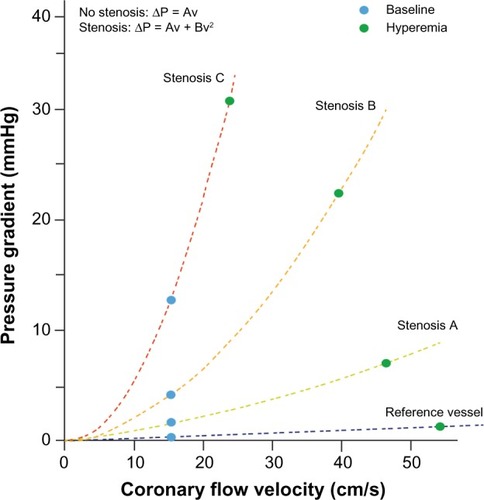
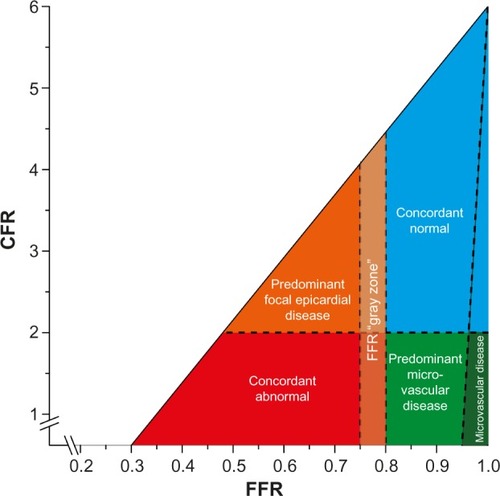
Figure 4 Conceptual plot of the fractional flow reserve (FFR)–coronary flow reserve (CFR) relationship.
Notes: Four main quadrants can be identified by applying the clinically applicable cutoff values for FFR and CFR, indicated by the dotted lines. Patients in the upper-right blue area are characterized by concordantly normal FFR and CFR, and patients in the lower-left red area are characterized by concordantly abnormal FFR and CFR. Patients in the upper-left orange area and lower-right light-green area are characterized by discordant results between FFR and CFR, where the combination of an abnormal FFR and a normal CFR indicates predominant focal epicardial, but non-flow-limiting, coronary artery disease, and the combination of a normal FFR and an abnormal CFR indicates predominant microvascular involvement in coronary artery disease. The small dark-green region in the lower right is characterized by an FFR near 1 and an abnormal CFR, indicating sole involvement of the coronary microvasculature. The FFR “gray zone” indicates the equivocal 0.75–0.80 FFR range. Copyright © 2015 by American Heart Association Inc. Adapted with permission from van de Hoef et al. van de Hoef TP, van Lavieren MA, Damman P, et al. Physiological basis and long-term clinical outcome of discordance between fractional flow reserve and coronary flow velocity reserve in coronary stenoses of intermediate severity. Circ Cardiovasc Interv. 2014; 7(3):301–311.Citation38