Figures & data
Figure 1 Flow chart of the exposed/nonexposed cohort design.
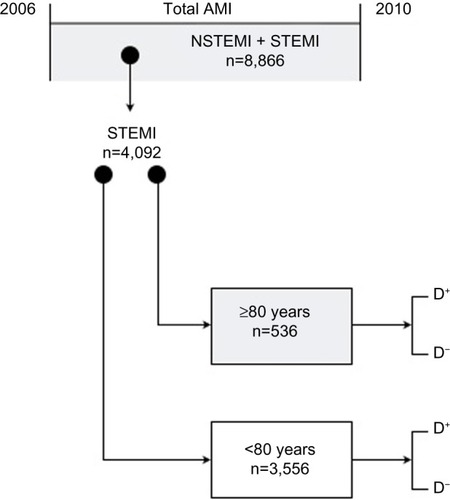
Table 1 Patient characteristics at admittance
Table 2 Risk for in-hospital mortality in patients 80 years old and older versus those younger than 80 years, showing variables with significant confounding effect and effect modifiers in the stratification analysis
Table 3 Adjusted risk for in-hospital mortality in patients 80 years old and older versus those younger than 80 years, controlling for the confounding effect of smoking and for the two effect modifiers, serum cholesterol and creatinine
Figure 2 Adjusted odds ratio (OR) of in-hospital mortality for patients 80 years old and older vs those younger than 80 years in relation to creatinine levels, controlling for smoking habits and for the median level of serum cholesterol (4.8 mmol/L).
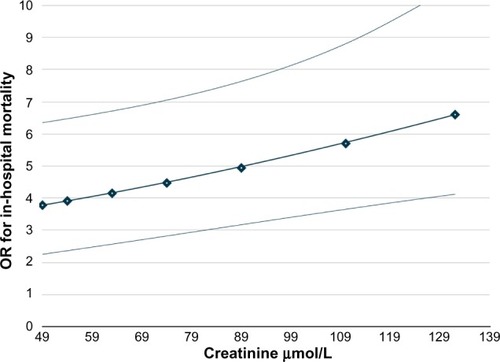
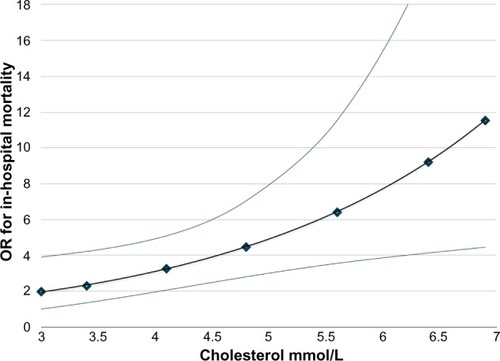
Figure 3 Adjusted odds ratio (OR) of in-hospital mortality for patients 80 years old and older vs those younger than 80 years in relation to total cholesterol levels, controlling for smoking habits and for the median level of serum creatinine (84 μmol/L).