
Figures & data
Table 1 Clinical characteristics of the studied groups
Figure 1 Bar chart showing the clinical indications for Holter ECG.
Abbreviations: ECG, electrocardiography; HHF, hypertensive heart failure; HHD, hypertensive heart disease; LVH, left ventricular hypertrophy; Une DOE, unexplained dyspnea on exertion; DM, diabetes mellitus; AUT Nero, autonomic neuropathy; DCM, dilated cardiomyopathy; VHD, valvular heart disease.
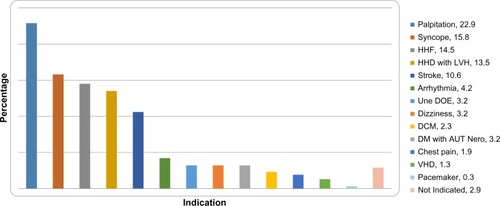
Table 2 Clinical indication
Table 3 Distribution of clinical indications for Holter ECG by age group
Figure 2 Seventy year-old woman, known hypertensive with an episode of ventricular tachycardia during 24-hour Holter ECG.
Abbreviation: ECG, electrocardiography.
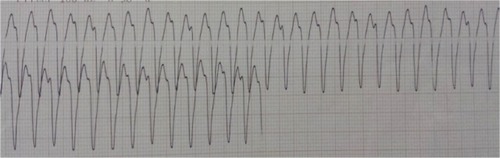
Table 4 24-hour Holter electrocardiogram rhythm distribution