
Figures & data
Figure1 Flow diagram of GLP-1 study selection.
Abbreviations: GLP-1RA, glucagon-like peptide-1 receptor agonists; RCT, randomized controlled trial; GLP-1, glucagon-like peptide-1.
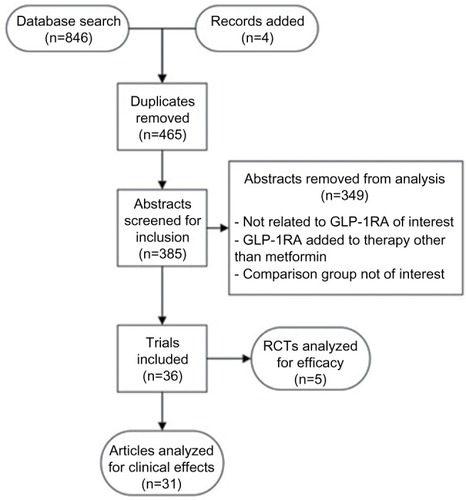
Figure 2 Flow diagram of SGLT2-I study selection.
Abbreviations: SGLT2-I, sodium–glucose cotransporter 2 inhibitors; RCT, randomized controlled trial;
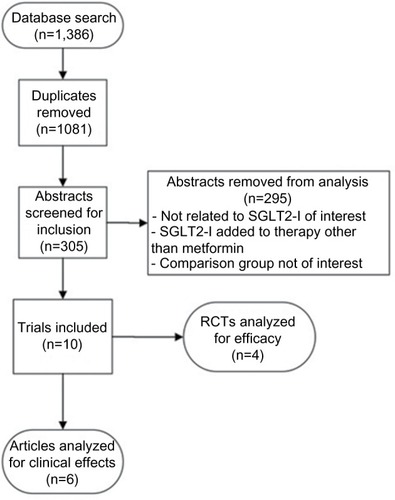
Table 1 Mean A1c reduction in clinical studies of GLP-1RA
Table 2 Mean A1c reduction in clinical studies of SGLT2 inhibitors
Table 3 Special considerations: GLP-1 receptor antagonists and SGLT2 inhibitors