
Figures & data
Table 1 Percentiles and days since withdrawing life-sustaining treatment to death in patients with stroke
Figure 1 Kaplan–Meier curves showing days from withdrawing life-sustaining treatment to death in 50 patients with severe cerebral infarction or hemorrhagic stroke (P=0.20).
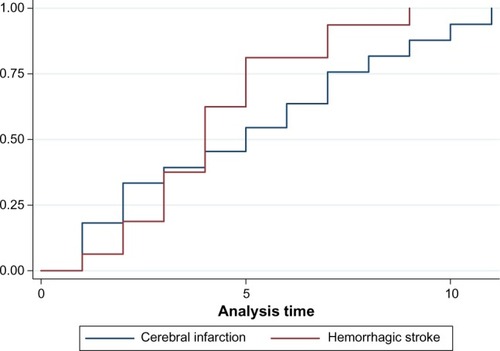
Table 2 Characteristics of patients who died in hospital after withdrawal or non-withdrawal of life-sustaining treatment