
Figures & data
Figure 1 Flow chart of the comparative cohort study. Laparoscopic aortobifemoral bypass versus open aortobifemoral bypass during the period 2005–2011.
Abbreviations: ABFB, aortobifemoral bypass; AIOD, aortoiliac occlusive disease; TASC, Trans-Atlantic Inter-Society Consensus.
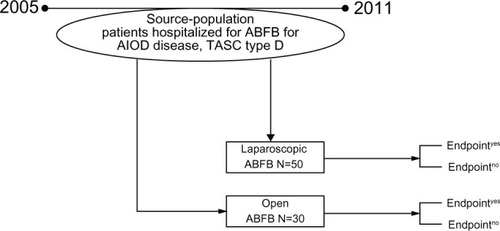
Table 1 Clinical characteristics of the patients operated either with totally laparoscopic aortobifemoral bypass (LABF) or with open aortobifemoral bypass (OABF) during the period 2005–2011
Figure 2 Survival analysis.
Notes: (A) Survival freedom from composite event in the 80 patients’ cohort, operated with totally laparoscopic aortobifemoral bypass (n=50) and open aortobifemoral bypass (n=30). Median follow-up time period of 4.12 years (range from 1 day to 9.3 years). (A) Composite event. (B) Graft thrombosis. (C) Systemic complications. (D) Mortality.
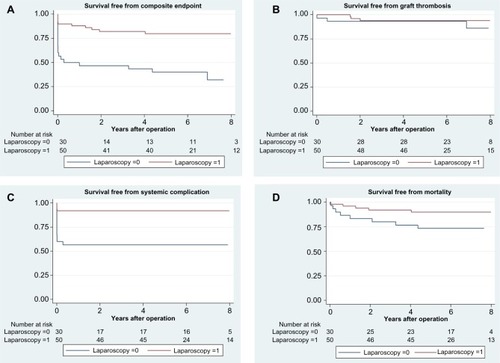
Table 2 Effect of procedure on composite outcome and its components, using the patient–time model
Table 3 Crude effect of laparoscopic aortobifemoral bypass versus open aortobifemoral bypass