
Figures & data
Table 1 Treatment Groups and Dosing Regimen
Table 2 Mortality of Animals Treated with Antimicrobials (A), Charcoal (C), or Both (B)
Table 3 Recovery of Animals Treated with Antimicrobials (A), Charcoal (C), or Both (B)
Figure 1 Kaplan–Meier curves of survival (A) or recovery (B) for animals treated with antimicrobials, charcoal, or antimicrobials + charcoal. A=antimicrobials (n=86); C=charcoal (n=86); B=both (n=86). For panel B, animals were censored when they died, as were animals that failed to recover over the 7-day period. Overall P-values were 0.0594 and 0.0063 for panels A and B, respectively (calculated using a Log rank test). The indicated P-values (A vs B, A vs C, and B vs C) were adjusted for multiple comparisons using the Holm-Šídák method and a family-wise significance level of 0.05. *P<0.05; **P<0.01.
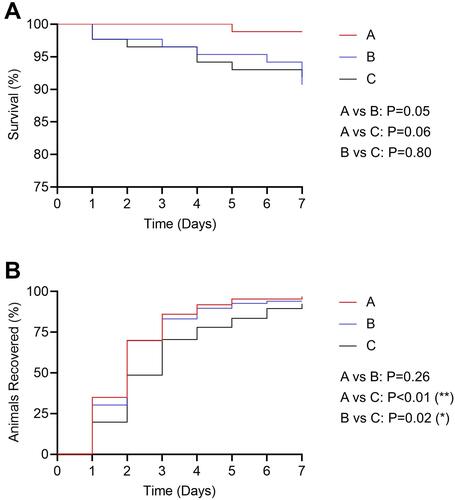
Table 4 Pathogens Detected in Fecal Samples from Diarrhetic Calves
Table 5 Enterichek Positivity Rate for Rotavirus at Days 0 and 7, Organized by Treatment Group
Table 6 Enterichek Positivity Rate for C. parvum at Days 0 and 7, Organized by Treatment Group
Table 7 Enterichek Positivity Rate for E. coli K99 (F5) at Days 0 and 7, Organized by Treatment Group
Table 8 Enterichek Positivity Rate for Coronavirus at Days 0 and 7, Organized by Treatment Group