Figures & data
Figure 1 Electrocardiogram recorded from a horse in atrial fibrillation.
Notes: Note the irregularly spaced QRS complexes, the absence of a P wave, and the lack of a smooth baseline. The coarse undulations that are occurring throughout the recording are F (fibrillation) waves. The green diamond indicates a QRS complex, the red square a T wave, and the gray arrow is pointing to an F wave.
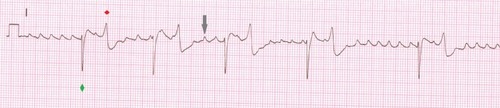
Figure 2 Electrocardiogram recorded from a horse in atrial fibrillation.
Notes: The QRS complexes, indicated by the black triangles, are irregularly spaced. In this recording, there are no P waves, and the F waves are fine.
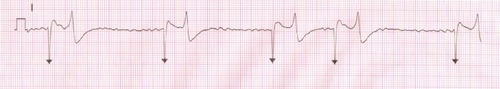
Figure 3 Electrocardiogram recorded from a horse with advanced second-degree atrioventricular block.
Notes: The QRS complexes in the middle of the strip are evenly spaced; however, there is a long gap before and after these. There are two P waves (gray arrows) that are not followed by QRS complexes; these are blocked cycles. The first one on the strip is following a previously blocked P wave. The gaps are of predictable length (gaps between P waves are the same, whether blocked at the atrioventricular node or not).
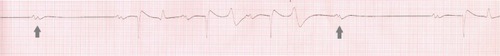
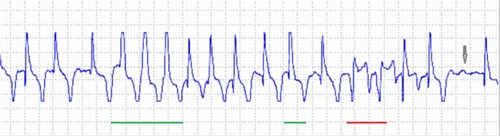
Figure 4 Holter electrocardiogram recording from a horse in atrial fibrillation.
Notes: In this recording, there is some artifact, and the electrocardiogram is cut off at the top and the bottom. The significant findings in this recording are the heart-rate response; the horse was standing in the stall. This is excessive heart-rate response to being fed. The instantaneous rate exceeds 150 bpm in the sinus beats mid-strip. The complexes that are underlined in green are widened and are considered to be ventricular ectopics. The complexes that are underlined in red have changed polarity as well as being widened, and are also considered to be ventricular ectopics. The arrow shows the “f” waves.