Figures & data
Table 1 Median and range as a percentage for all major omega-3 fatty acids, linoleic acid, and arachidonic acid evaluated in serum phospholipids as measured by capillary gas–liquid chromatography
Figure 1 Box and whisker plot of mean log-transformed serum adiponectin concentration and its association with BCS.
Notes: The box represents the 25th and 75th percentile with the mean as the line in the box, whiskers are the 97.5th and 2.5th percentiles. No significant differences were found between groups.
Abbreviation: BCS, body condition score.
Abbreviation: BCS, body condition score.
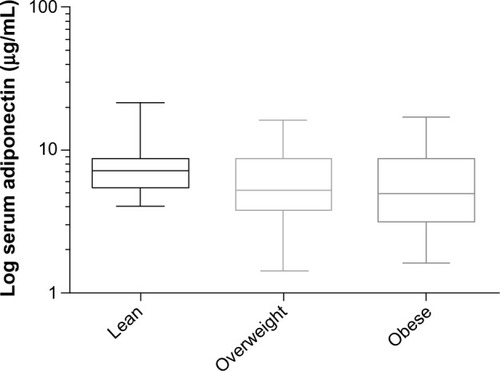
Table 2 Multivariable linear regression showing the effect of EPA, DHA, and age on adiponectin; R2=0.19; P=0.001
Figure 2 Box and whisker plot of mean log-transformed serum leptin concentration and its association with BCS.
Notes: The box represents the 25th and 75th percentile with the mean as the line in the box, whiskers are the 97.5th and 2.5th percentiles. *Significant difference between the lean group and the obese group (P<0.001); **significant difference between the lean versus the overweight group (P<0.001).
Abbreviation: BCS, body condition score.
Abbreviation: BCS, body condition score.
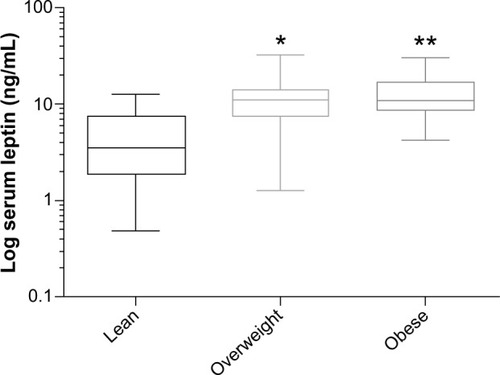
Table 3 Multivariable linear regression showing the effect of DHA, DPA, and BCS on leptin; R2=0.39; P<0.0001
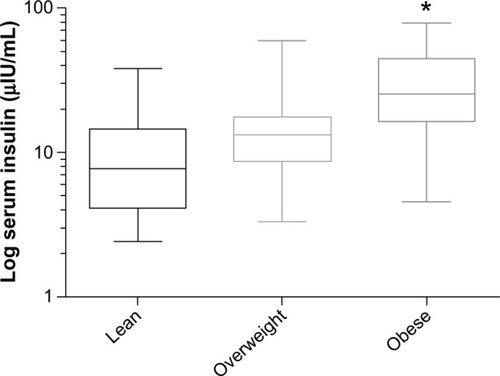
Figure 3 Box and whisker plot of mean log-transformed serum insulin and its association with BCS.
Notes: The box represents the 25th and 75th percentile with the mean as the line in the box, whiskers are the 97.5th and 2.5th percentiles. *Significant difference between obese and lean; and overweight and obese (P<0.001).
Abbreviation: BCS, body condition score.
Abbreviation: BCS, body condition score.