Figures & data
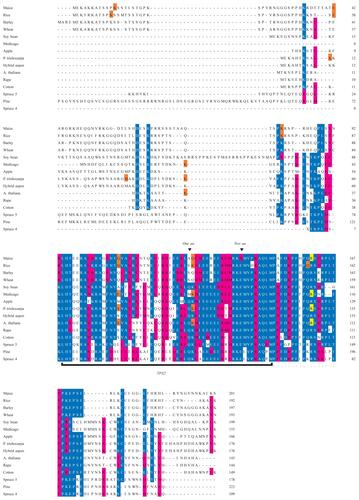
Figure 1 Sequence alignment of M20L proteins made with the MAFFT alignment tool. The TPX2 domain is marked with a black bar and the extended TPX2 domain by a dotted line under the sequences. Notes above the TPX2 domain indicate sites where residues are lost relative to the Pfam domain model of TPX2. The identity or similarity to a consensus sequence is indicated in blue and red (respectively), the last codon of an exon in orange, and the exon/intron boundary in frame 2 in yellow.
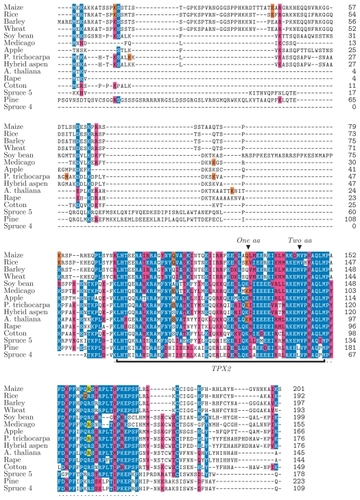
Table 1 A list of MAP20-Like gene models (M20L) in different plant species
Figure 2 (a) A multiple alignment made with DNA sequences of the extended TPX2 domains of the M20L protein sequences. Differences with respect to A. thaliana are noted, and the conserved bases are indicated by dots. The third codon position is printed in grey. (b) Similarity plot graph made with the extended TPX2 domain with reference to relative residue position (both DNA and Protein sequences) using EMBOSS plotcon software using a standard window size of 4.
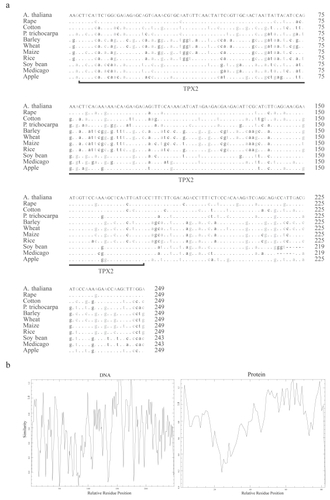
Figure 3 Phylogenetic tree made with all the available and newly found eukaryotic proteins containing a TPX2 domain. The Bayesian posterior probability is indicated by numbers to the right of the edge in question. The clades with M20L proteins and KLEEK motif are marked. Genes with reported phenotypes in Arabidopsis are marked in red (CitationYuen et al 2003). The gene noted as AtTPX2 by (CitationPerrin et al 2007) is annotated in green.
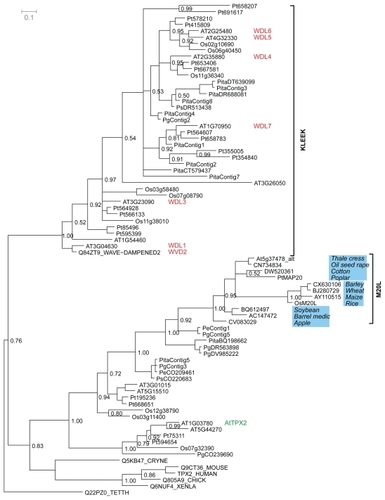
Figure 4 A phylogenetic tree made with the extended TPX2 domain.
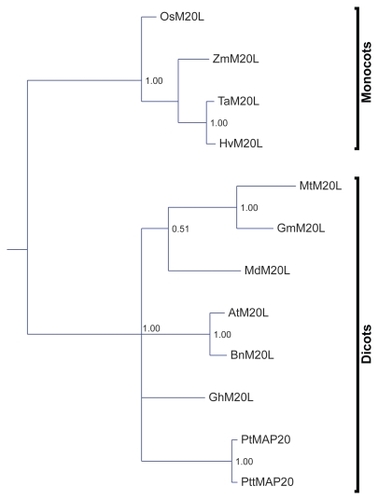
Figure 5 Genomic organization (to scale) of TPX2 genes in the genomes of (a) Populus trichocarpa, (b) Oryza sativa, and (c) Arabidopsis thaliana.
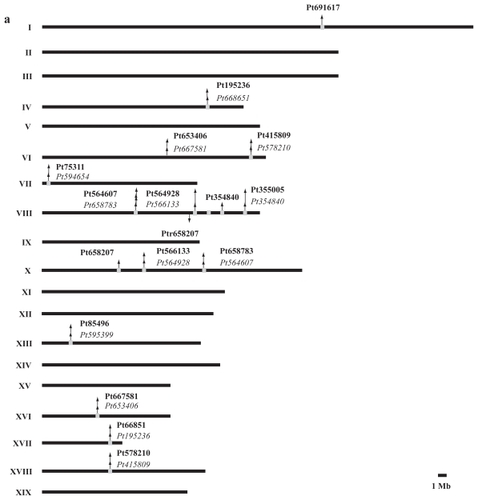
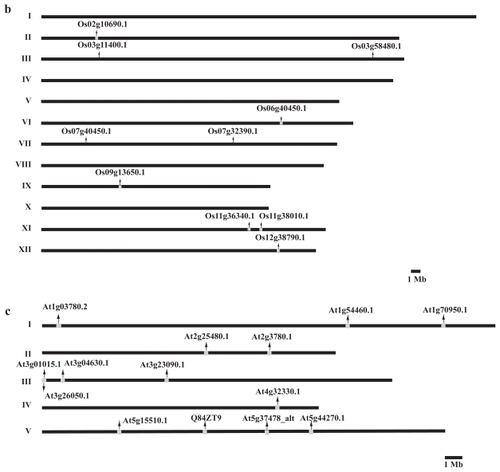
Figure 6 Relative expression levels of the TPX2 genes in different tissue types of Arabidopsis thaliana. Data from http://www.arabidopsis.org/. The expression patterns for WDL1 (At3g04630) and WVD2 (At1g3780) are roughly the same, with elevated levels in inflorescence tissue.
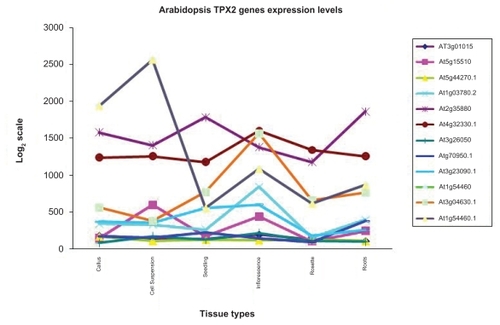
Table 2 Gene pairs and their respective linkage groups present in Populus trichocarpa, Oryza sativa and Arabidopsis thaliana
Figure 7 M20L gene structure: the positions (in base pairs from the translation start) of gene CDS are marked, to scale, with dark boxes while the thick lines correspond to introns. The TPX2 regions are marked with dark red lines.
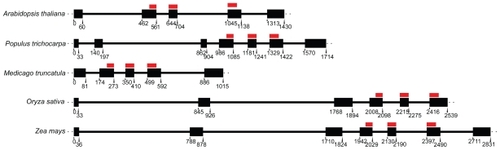
Figure 8 Possible regulatory elements and promoters of M20L. Upstream regions with predicted TATA boxes are indicated by a green triangle, motif 1 by a red box, motif 2 by a blue box, and EST hit regions by dark pink lines. For A. thaliana, the core promoter given in AGRIS (CitationPalaniswamy et al 2006) is indicated by a red line. The lines are scaled to actual sequence length and positions are given in base pairs from translation start.
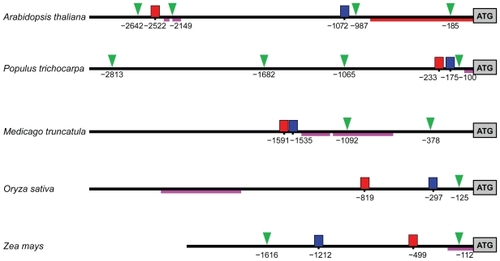
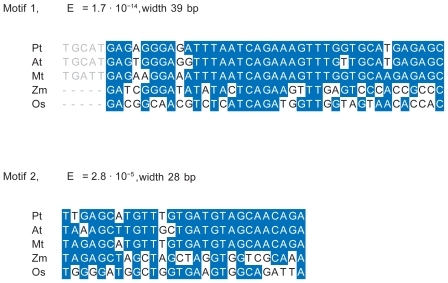
Figure 9 Sequence alignments for the motifs 1 and 2. Blue color indicates identity to the consensus sequence. The left flank of motif 1 shows the extension of this motif in dicots.
Supplementary Figure 1 Sequence alignment of MAP20 proteins made with the MUSCLE alignment tool. The TPX2 domain is marked with a black bar and the extended TPX2 domain is indicated using dots. Notes above the TPX2 domain indicate where residues are lost relative to the Pfam domain model. Colors indicate similarity to consensus sequence.
Supplementary Table 1 Microtubule associated and binding protein reported in pfam by July 2007
Supplementary Table 2 Protein sequences of gene models