Figures & data
Table 2 Primers and annealing temperatures used for qRT-PCR studies
Table 1 Scrapie-associated expression alterations in brain at 104 dpi using Affymetrix microarrays
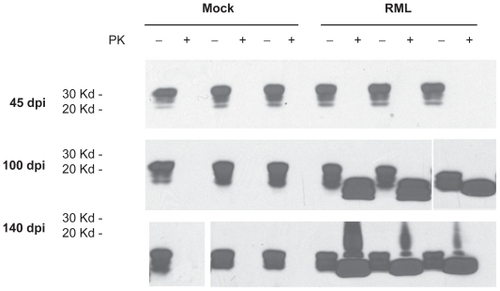
Figure 1 Prion protein and proteinase K resistant prion protein accumulation in brains from mock and RML-Chandler scrapie-infected mice at 45, 100, and 140 days post-infection. Western blot analysis showing prion protein antibody staining (SAF83) of protein extracts that were untreated or treated with proteinase K.
Appendix 2 GFAP immunoreactivity in scrapie-infected and mock-infected mice at 104 and 146 dpi. Hippocampus region of the brain from sections from ME7, 22L, and RML-Chandler-infected mice stained with GFAP antibodies (brown) and counterstained with hematoxylin (blue). Note the increase in GFAP immunoreactivity in the scrapie compared to mock-infected mice.
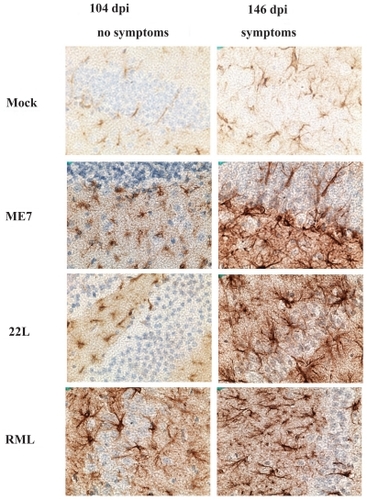
Table 3 Confirmation of scrapie-associated gene expression alterations using qRT-PCR
Appendix 1 Brain gene expression in mice infected with ME7, 22L, and RML-Chandler strains of scrapie vs. mock-infected mice using qRT-PCR
Table 4 Hormone and hormone regulator gene expression in scrapie-infected vs mock-infected mice using qRT-PCR
Figure 2 GFAP antibody staining in the anterior pituitary gland (adenohypophysis) from scrapie- and mock-infected mice at 45, 100, and 140 days post-infection. Sections were stained with GFAP antibodies (brown) and counterstained with hematoxylin (blue) and eosin (pink). Images were collected with 20 × and 60 × objectives as indicated. Note increased GFAP immunoreactivity in glandular cells of anterior pituitary in sections from scrapie-infected mice relative to mock-infected mice.
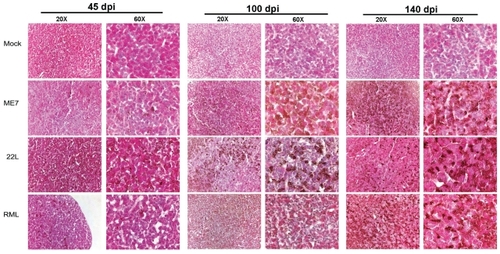
Figure 3 Growth hormone (Gh) antibody staining in the anterior pituitary gland (adenohypophysis) from scrapie- and mock-infected mice at 45, 100, and 140 days post-infection. Images show sections stained with Gh antibodies (brown) and counterstained with haematoxylin (blue). Images were collected with 20 × and 60 × objectives as indicated. Note increased Gh immunoreactivity in glandular cells of anterior pituitary in sections from scrapie-infected mice relative to mock-infected mice.
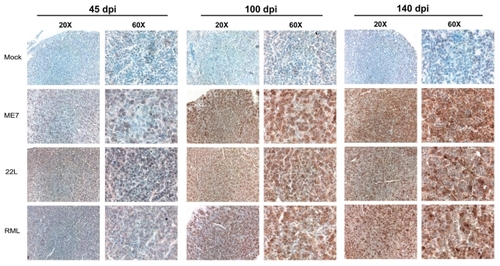
Table 5 Spleen gene expression in scrapie-infected vs mock-infected mice at 46, 104, and 144 dpi
Appendix 3 Spleen gene expression in mice infected with ME7, 22L, and RML-Chandler strains of scrapie vs. mock-infected mice using qRT-PCR
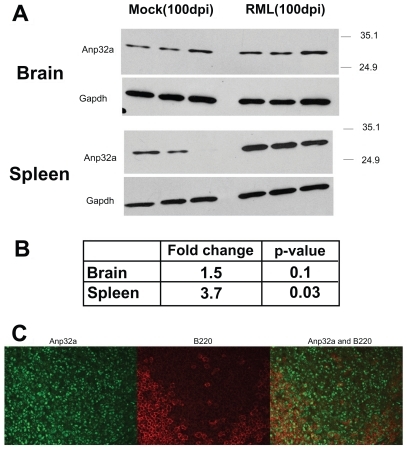
Figure 4 Anp32a protein accumulation in brain and spleen of scrapie-and mock-infected mice. A) Western blot results from three mock and three scrapie-infected mice at 100 days post-infection stained with anp32a antibodies, and stripped and reprobed with Gapdh antibodies. B) Densitometry analysis of western blot results showing relative amounts of anp32a accumulation in scrapie verses mock-infected mice. C) Anp32a (green) and B220 (red) antibody staining in spleen tissue from scrapie-infected mouse. Note: B220 is a B cell marker.