Figures & data
Figure 1 Schematic representation of the experimental setup used for UMTS field exposition of suspension-cultured cells. The distance between the dipole antenna and the sample solution was 1 m. The dipole was placed in front of a metallic reflector. The linearly polarized microwave carrier frequency of 1.9 GHz was modulated with a special UMTS signal (CitationBilz et al 2001).
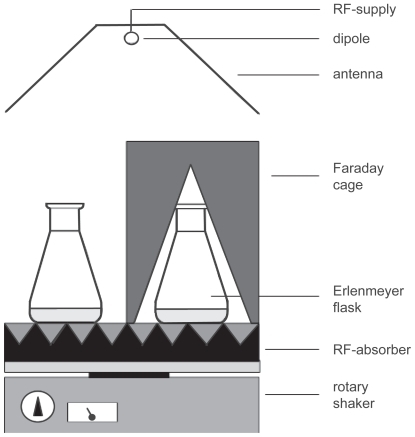
Figure 2 Hierarchical cluster trees of arrays hybridized with cDNA of control (uneven numbers) or microwave-exposed (even numbers) samples. Numbers on the edges indicate bootstrap values. A Clustering of 6 arrays using 10 genes with highest variance in signal intensity. B Clustering of 8 arrays (6 original arrays and 2 arrays hybridized later), bootstrap values from trees with 10 genes are given in bold numbers, those of 20 genes in normal numbers in parentheses.
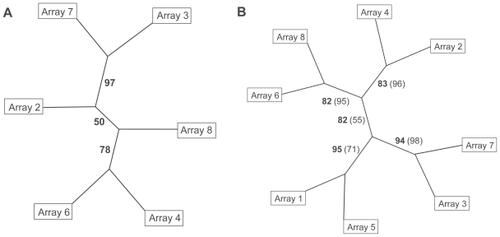
Table 1 Genes with the highest variance in expression signals. The variance was determined over all 8 arrays hybridized with control or microwave exposed samples. The fold change and corresponding p-values are given for the microarray assay as well as for quantitative real time RT-PCR
Table 2 Genes with most significant p-values (p > 0.05). Fold changes and corresponding p-values for genes differentially expressed between microwave exposed and control samples in the microarray assay
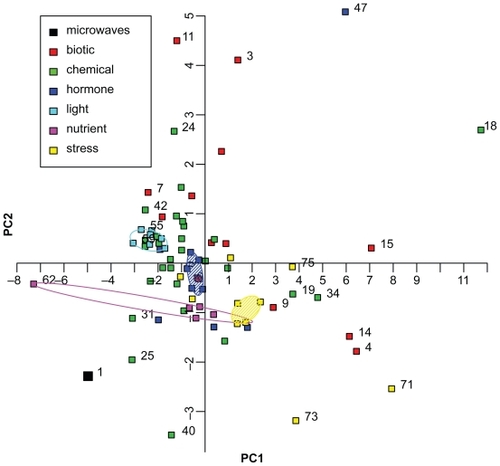
Figure 3 Principal Component Analysis of 75 ATH1 microarray datasets. The fold changes of 10 genes differentially expressed in the microwave dataset (, no. 1 in Figure 3) were compared with fold changes of 74 ATH1 microarray datasets of Genevestigator (no. 2 to 75). The categories based on several datasets are: “biotic”, “chemical”, “hormone”, “light”, “nutrient”, and “stress” conditions, and are shown by symbols as indicated in the graph. Convex hulls encircle datasets treated with different light conditions (turquoise) or nutrient availability (magenta). Datasets treated with phytohormones (blue) or stress conditions (yellow) are encircled by a robust convex hull, disregarding data points on the outer convex hull and encompassing the remaining data points. The following datasets are displayed but not all of them are numbered in the graphic: 1. microwaves, 2. A. brassiciola, 3. A. tumefaciens, 4. B. cinerea, 5. E. cichoracearum, 6. E. orontii, 7. F. occidentalis, 8. M. persicae, 9. M. persicae, 10. mycorrhiza, 11. nematode, 12. P. infestans, 13. P. rapae, 14. P. syringae, 15. P. syringae, 16. 2,4,6-trihydroxybenzamide, 17. 4-thiazolidinone/acetic acid, 18. 6-benzyl adenine, 19. AgNO3, 20. aminoethoxyvinylglycine (AVG), 21. brassinazole 220, 22. brassinazole 91, 23. chitin, 24. high CO2, 25. cycloheximide, 26. daminozide, 27. furyl acrylate ester, 28. hydrogen peroxide, 29. ibuprofen, 30. isoxaben, carbobenzoxyl-leucinyl-leucinyl-leucinal (MG13), 31. norflurazon, 33. naphthylphthalamic acid (NPA), 34. ozone, 35. paclobutrazole, 36. p-chlorophenoxyisobutyric acid (PCIB), 37. n-octyl-3- nitro-2,4,6-trihydroxybenzamide (PNO8), 38. prohexadione, 39. propiconazole, 40. syringolin, 41. 2,3,5-triiodobenzoic acid (TIBA), 42. uniconazole, 43. zearalenone, 44. absisic acid, 45. 1-aminocyclopropane-1-carboxylic acid (ACC), 46. brassinolide, 47. brassinolide/H3BO3, 48. ethylene, 49. giberellic acid (GA3), 50. indole acitic acid, 51. methyl-jasmonate, 52. salicylic acid, 53. zeatin, 54. white light, 55. blue light, 56. far red light, 57. red light, 58. UV-A-irradiation, 59. UV-AB-irradiation, 60. white light, 61. Cs+, 62. glucose/sucrose, 63. (−) potassium, 64. (−) nitrogen, 65. (−) sulfur, 66. cold, 67. drought, 68. genotoxic, 69. heat, 70. hypoxia, 71. osmotic, 72. oxidative, 73. salt, 74. UV-B, 75. wounding.
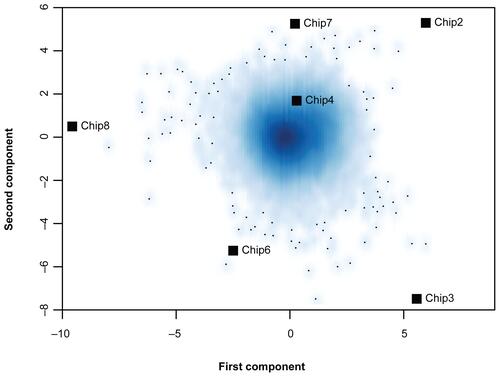
Supplementary Figure 1 Correspondence analysis of expression signals of all genes on the 6 ATH1 microarrays of the microwave dataset. Smoothed color density representation of genes. Dark blue areas reflect high densities of genes and light blue areas represent low gene densities. Single genes in the outer area are marked by small black points. Single microarrays are marked with black squares. There is no clustering of two groups of arrays along the first or second component axis (Array 1 and 5 were left out, since these were hybridized later).
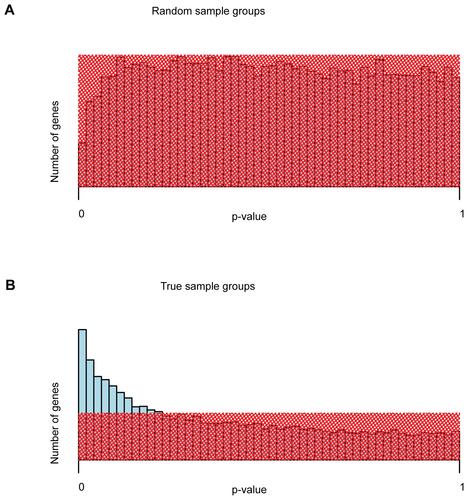
Supplementary Figure 2 Distribution of unadjusted p-values of differential gene expression. (A) Unadjusted p-values for a sample grouping irrespective of microwave treatment. (B) Unadjusted p-values for true sample grouping: microwave treated vs. untreated samples. Shaded red areas represent the uniform distribution of p-values of no differential expression. For the true grouping, blue bars reaching out of the shaded area represent differentially expressed genes. Naturally, after multiple testing correction of p-values, the number of genes with significant p-values () is substantially lower than what could be estimated from the distribution of unadjusted p-values.
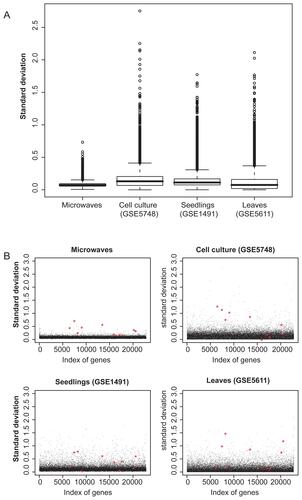
Supplementary Figure 3 Comparison of gene expression variability of the microwave dataset with untreated control microarrays from publicly available datasets. (A) Box-plots of standard deviations of all genes on the ATH1 microarray. The microwave dataset, the controls of a cell culture dataset (GSE5748), those of seedlings (GSE1491), and of leaves (GSE5611) are shown. (B) Scatter-plots of standard deviations of all genes on the ATH1 microarray. The 10 differentially expressed genes of the microwave dataset are highlighted with red stars in each of the datasets. The controls of the cell culture, seedlings and leaves dataset are accessible at NCBI GEO database, (http://www.ncbi.nlm.nih.gov/geo) with their GSE identifier. Raw data of the microarray hybridizations were normalized with the same methods as the microwave microarrays, as described in the Methods section.