Figures & data
Figure 1 Six-step voxelization process for the quantization and characterization of protein surfaces in our AEP system.
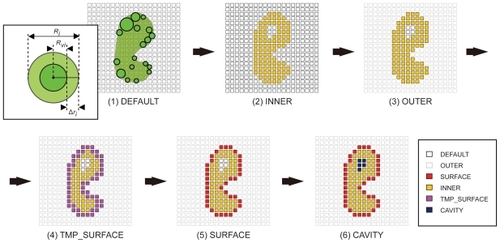
Table 1 Targeted 20 protein pairs
Table 2 Docking calculation results to validate the shape complementarity evaluation using voxel model
Table 3 Comparison prediction performance between AEP and ZDOCK
Table 4 Evaluations about the prediction performance for various of grid size
Figure 2 Normalized PSC score SSPC of the receptor of each ligand. The horizontal axis shows the PDB index as in , and the vertical axis shows the normalized PSC score SSPC.
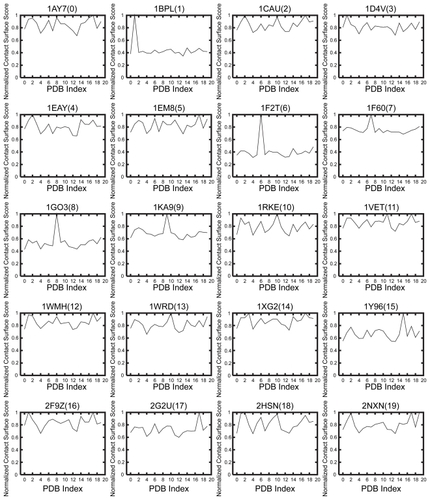
Figure 3 Affinity score Saffinity of the receptor of each ligand. The cutoff value is 7.54σ. The filled arrowhead (▾) denotes a protein pair in which Saffinity ≥ 7.54σ and is thus biologically relevant; the unfilled arrowhead is a protein pair incorrectly identified as being biologically relevant (ie, false positive). The horizontal axis shows the PDB index, and the vertical axis shows the affinity score Saffinity.
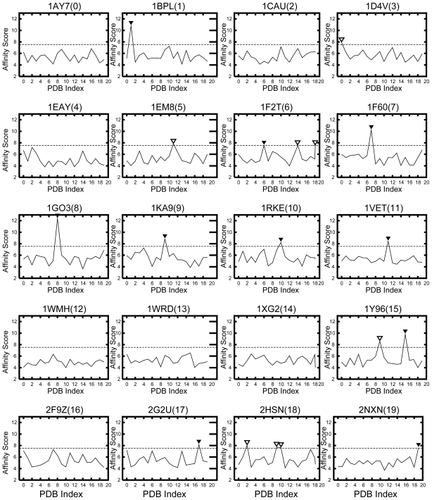
Figure 4 Matrix of affinity score Saffinity with weighting parameters wc = 0, and ws = 1. The points on the diagonal line show the biologically relevant pairs, and the circles show the biologically relevant pairs where the AEP system provided a successful prediction.
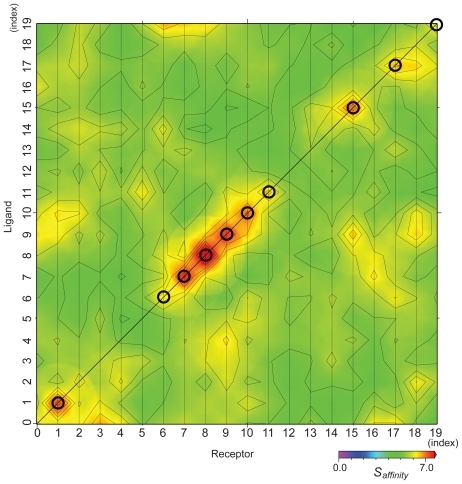
Figure 5 The ROC curve for the prediction performance of the AEP system. The peak performance achieved at point P (cutoff value is 7.54σ), and their values are shown in the bottom-right corner.
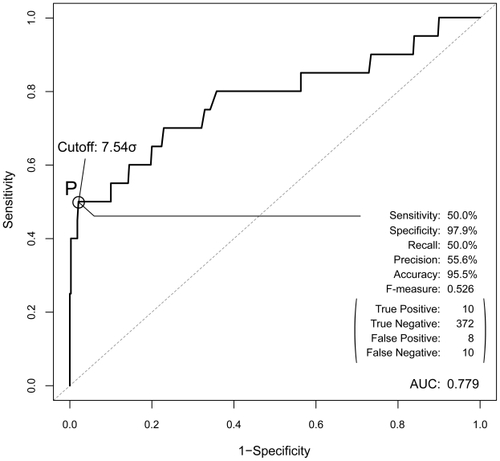
Figure 6 Relation between the size of each protein pair (ie, number of atoms) needed for biological relevance and the affinity analysis results. The horizontal axis shows the number of atoms in the receptor, and the vertical axis shows that in the ligand. The symbols denote the protein pair. The unfilled circles (○) denote a protein pair that was identified as biologically relevant by the AEP system, and the filled circles (●) denotes a protein pair identified as not biologically relevant.
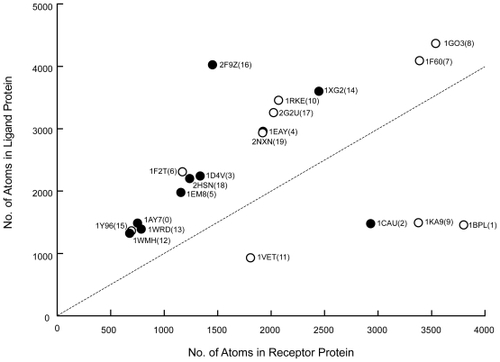
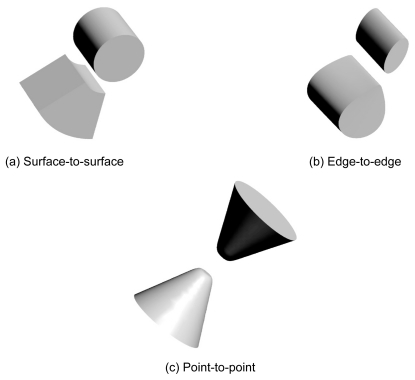
Figure 7 Models for docking styles. Type (a), called “surface-to-surface”, is most popular docking among our docking complex structures. Type (b) is called “edged-to-edge” contacting only using each edge of receptor and ligand. Type (c) is called “point-to-point” which is most less performance by shape complementarity search.