Figures & data
Figure 1 Schematic representation of the screening methods in the current study. The same procedure was applied to models A and B. The protein set consists of the proteins listed in Appendixes A and B.
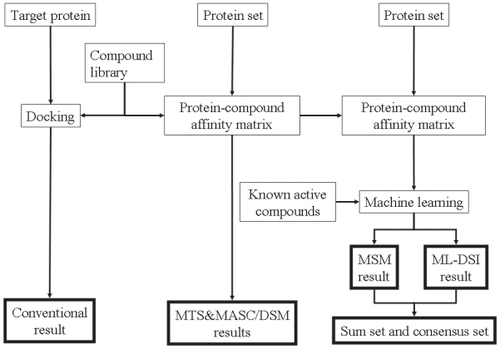
Table 1 q values and hit ratios for target protein models A and B
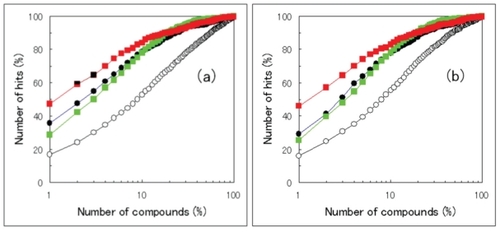
Figure 2 Database enrichment curves for models A and B. Filled circles, open circles, green squares, and red squares represent the results by the MSM-MTS method, the ML-DSI method, the sum sets of predicted compounds by the MSM-MTS and the ML-DSI methods, and the consensus sets of predicted compounds by the MSM-MTS and the ML-DSI methods, respectively. a: database enrichment curves for model A, in which the target protein structures are the original crystal structures. b: database enrichment curves for model B, in which the target protein structures are the model structures obtained by the MD simulations in explicit water.