Figures & data
Figure 1 A schematic diagram of gene expression analysis using a Bayesian method as applied to identify genetic interaction for anticancer effect of bortezomib in ATL cells.
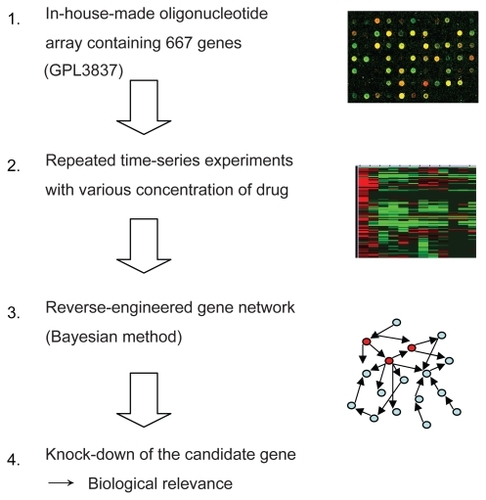
Figure 2 Estimated binary relations among 3 genes. When we consider permutations of three nodes X1, X2 and X3, the total number of the possible network structures is 25.
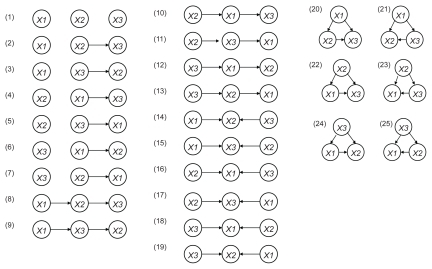
Figure 3 Artificial gene regulatory network integrated to SPARC conduced by VoyaGene®. Genes are analyzed by the Bayesian statistical network analysis. Nodes indicate genes and edges represent regulations between genes; red line (when gene A is up-regulated, gene B is up-regulated), blue line (when gene A is up-regulated, gene B is down-regulated).
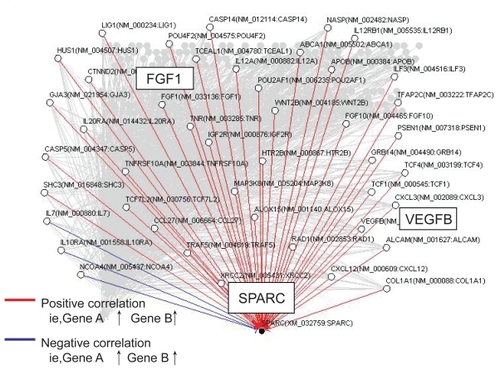
Figure 4 Comparison of gene expression levels between cell lines and a patient sample. Percent of ATL cells in the peripheral blood specimens is 76% respectively. Relative gene expression levels are expressed as ratios (copy numbers of target gene/copy numbers of GAPDH). In the presence of bortezomib, and down-regulation of SPARC is evident in both cell lines and a patient sample.
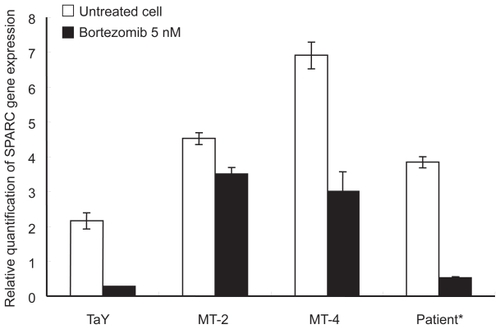
Figure 5 Effect of SPRC siRNA on TaY cells. Twenty four hours after transfection with SPARC or control siRNA, bortezomib is added to the culture. A: Western blot reveals that SPARC siRNA induce modest reduction of SPARC protein levels in TaY cells, while SPARC siRNA does not affect β-actin protein levels. SPARC expression is remarkably reduced when cells were treated with SPARC siRNA followed by bortezomib. B: Reduction of target gene by RNAi: relative gene expression levels are expressed as ratios (copy numbers of target gene/copy numbers of GAPDH).
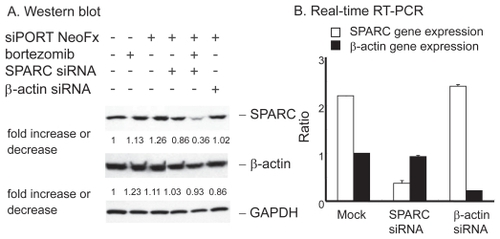
Figure 6 SPARC siRNA enhances bortezomib-induced cell death on TaY cells. Bortezomib induces antiproliferative effect in TaY cells (p = 1.33E-07). Inhibition of SPARC gene expression by SPARC siRNA also enhances the antiproliferative activity of bortezomib (p = 0.039).
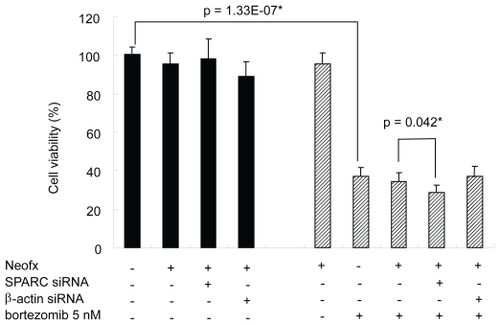
Figure 7 SPARC siRNA enhances bortezomib-induced apoptosis in TaY cells. Apoptosis is expressed as a percent of Annexin V positive cells in bortezomib and or siRNA treated cells. SPARC siRNA induces apoptosis in the presence of 5 nM of bortezomib (p = 0.011).
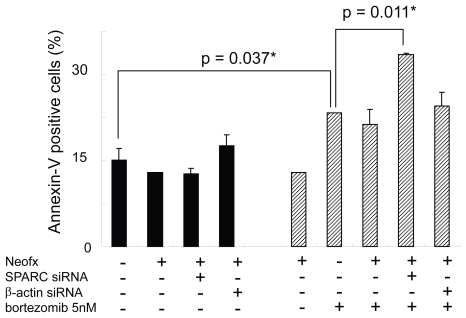
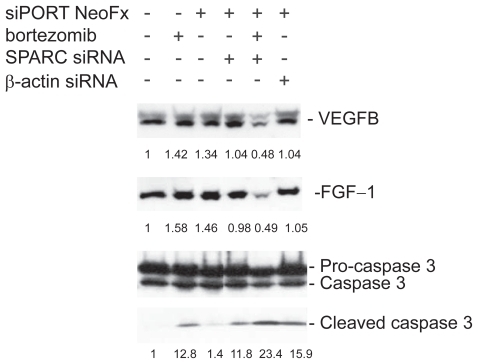
Figure 8 Inhibition of VEGF-B and FGF-1 expression in bortezomib and siRNA treated TaY cells. In the presence of bortezomib, inhibition of SPARC gene expression remarkably suppresses either VEGF-B or FGF-1 expression. In contrast, SPARC siRNA enhanced the cleavage of caspase 3 in the presence of bortezomib, indicating that SPARC siRNA enhanced bortezomib-induced apoptosis in TaY cells.
Supplementary File 1 Formula for score value
Supplementary File 2 List of genes with scores greater than 0.2 selected by Voyagene® (Raw data)
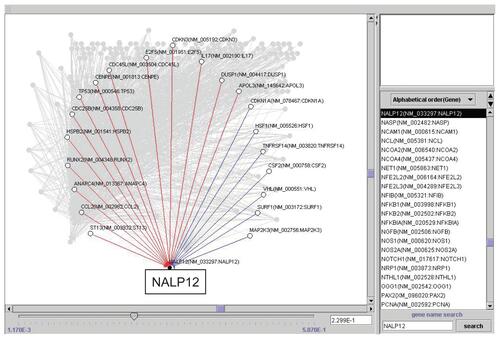
Supplementary File 3a Artificial gene regulatory network integrated to NALP12 conducted by VoyaGene®.
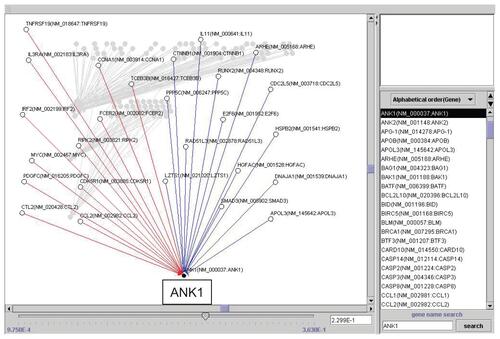
Supplementary File 3b Artificial gene regulatory network integrated to ANK1 conducted by VoyaGene®.