Figures & data
Table 1 Bladder cancer diagnostic genes
Table 2 Accuracy of all ratio combinations in predicting tumor diagnosis in training sets A and B combined
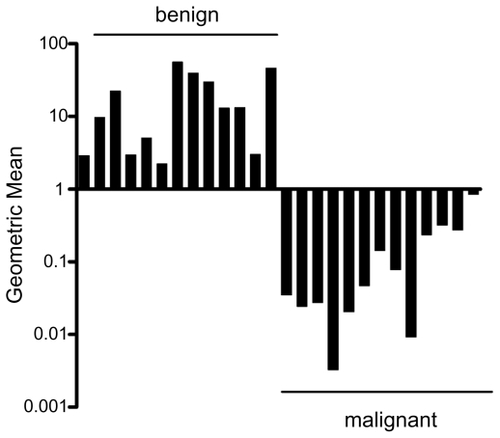
Figure 1 Verification of expression level ratios as a diagnostic tool in bladder cancer. Quantitative RT-PCR was used to obtain gene expression levels for the six bladder cancer diagnostic genes and calculate the geometric mean of the five-ratio diagnostic test (SPARCL1/MIF, S PARCL1/RPN2, MYH11/RPN2, FHL1/MIF, FHL1/RPN2) in frozen samples of benign bladder urothelium (n = 13) and bladder cancer (n = 13). This test identified 26 of 26 samples and did not result in any false-negatives. Note that the y-axis is in log scale.