Figures & data
Figure 1 The selection scheme of the most probable biological interfaces. The most probable biological interface in each crystal is selected among the biological contact and the crystal-packing contact(s) according to the scheme shown in this flow chart. The explanation of the scheme is described in the text.
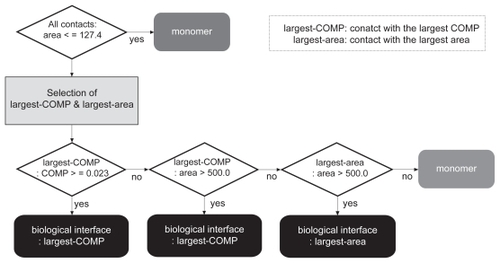
Table 1 Comparison of the structures determined by X-ray and NMR
Table 2 Comparison of the structures determined in the different crystallization conditions
Figure 2 The relative frequencies of the COMP values in the biological (BIO, thick line) and crystal-packing (CRY, dotted line) contact sets.
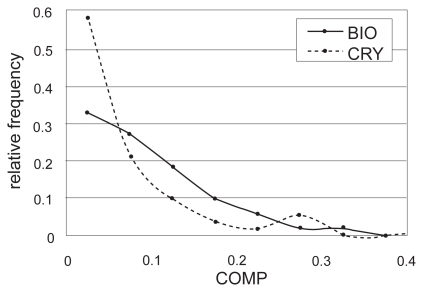
Table 3 Results of the weight optimization of the COMP
Figure 3 The relative frequencies of the complementarities for a) hydrophobicity, b) electrostatic potential and c) shape. The thick lines in the three figures indicate the distributions of complementarities in the biological contact set (BIO), and the dotted lines indicate those in the crystal-packing contact set (CRY).
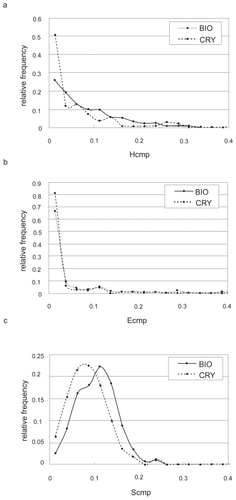
Figure 4 The scatter plots between the COMP and the contact area in a) the biological contact set (BIO) and in b) the crystal-packing contact set (CRY). In each figure, each sign indicates each contact, and the horizontal dotted line and the two vertical dotted lines indicate the threshold of the COMP (0.023) and the contact area criteria (127.4 and 500.0 Å2), respectively. The lower figures in both a) and b) show an enlarged display of the region smaller than 1000.0 Å2. Some entries discussed here are marked with their PDBIDs.
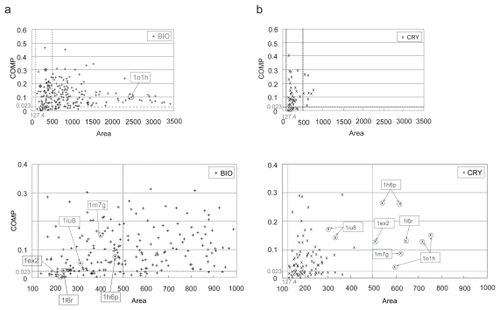
Table 4 Summary of the classification, the discrimination and the evaluation
Table 5 Summary of the evaluation results
Figure 5 The dimer structures within the ASUs in 1d6j a) and 1 m 7 g b). The regions circled by the yellow lines indicate the N-terminal regions of one subunits in the both ASU dimers. The lower figures show the rotated dimers in the upper figures by 90 degrees around the two-fold axis. In the lower dimer of 1 m 7 g b), the interaction between the ASU subunit colored in blue and the subunit colored in white which exists in the adjacent cell to the center unit cell corresponds with the crystal-packing contact mentioned in the text.
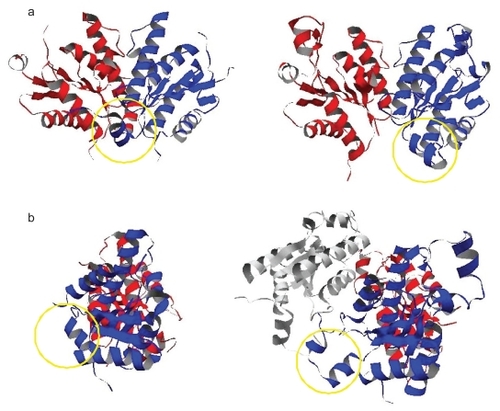
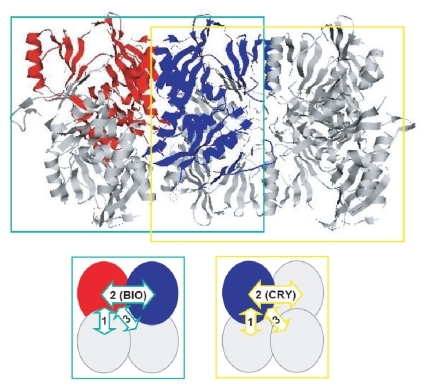
Figure 6 Two possible tetramers in the crystal of 1auv. In the upper figure, the left complex surrounded by the green line is the biological tetramer according to the primary citation of this entry, and the right one surrounded by the yellow line is another possibility. Both tetramers are tightly packed with each other in the crystal. The lower figures show the biological contacts in these two tetramers by the arrows having the same color as the line surrounding the corresponding tetramer. The green arrow with “2 (BIO)” represents the biological contact which has the second largest area in the left tetramer. The yellow arrow with “2 (CRY)” corresponds to the crystal-packing contact which is the second largest contact in the right tetramer and is also the crystal-packing contact formed between the left tetramer and the neighboring tetramer including the right half of the right tetramer on the left side. The arrows with “1” represent the contacts with the largest area in both tetramers; these two contacts can be similar.