Figures & data
Figure 1 Correlation of Fold-X predictions and experiment. The straight line is a least-square fit between experimentally determined Ca2+-protein affinities (ΔGexp) and affinities predicted with Fold-X (ΔGpred). Pearson correlation coefficient is r = 0.67. Data.Citation8
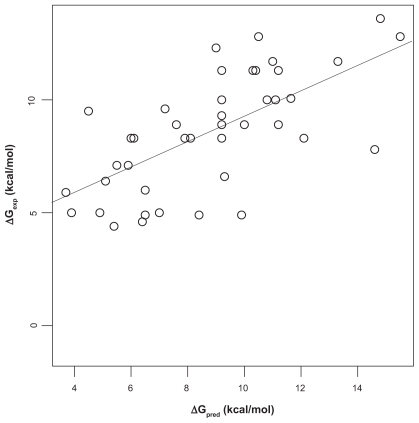
Figure 2 Correlation of AutoDock vina predictions and experiment. The dashed straight line is the least-square fit between experimentally determined Ca2+-protein affinities (ΔGexp) and affinities predicted with AutoDock vina (ΔGpred). Pearson correlation coefficient is r = 0.71. If the outlier in the lower-left is dropped, r decreases to 0.63 (solid line). Experimental affinities.Citation8
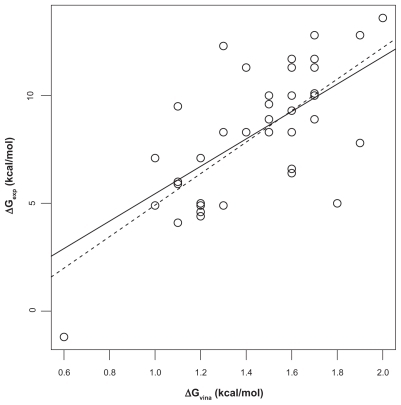
Table 1 Spearman rank correlation ρ of four models with experimental affinities ΔGexp and residuals e
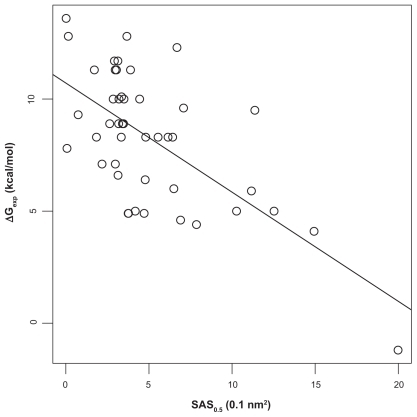
Figure 3 Correlation of SAS (probe radius 0.5 Å) and experiment. The straight line is the least-squares fit between experimentally determined Ca2+-protein affinities (ΔGexp) and the solvent accessible surfaces (SAS) of the Ca2+-ions. Spearman rank correlation coefficient ρ is −0.53 (P = 2 · 10−4 for null-hypothesis ρ = 0). Experimental affinities.Citation8