Figures & data
Figure 1 Boxplot of descriptor performances (mean AUC). On the y-axis the AUC values for all descriptors analyzed are shown as a boxplot.
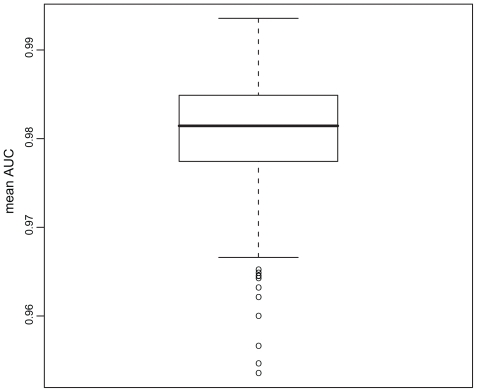
Table 1 Normalized positional residue frequency at helix termini N1. The descriptor values for each amino acid (single letter code) are shown
Figure 2 Structural plot of descriptor for all families.
Notes: The x-axis represents the normalized sequence position, whereas the y-axis denotes the descriptor value. The interval of all existing values at each position is shown for each family. A: Arf; B: Rab; C: Ran; D: Rho.
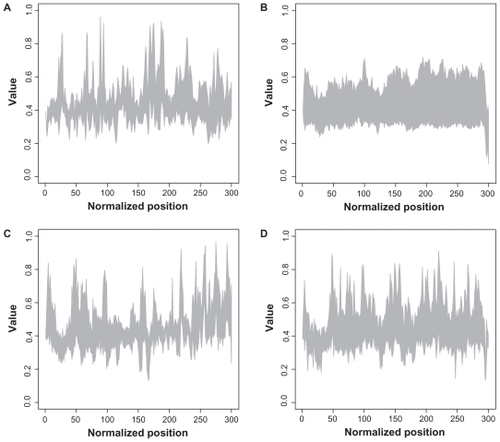
Figure 3 ROC curve of the best performing random forest. (1-specificity) against sensitivity, ranging from 0 to 1 on both axes.
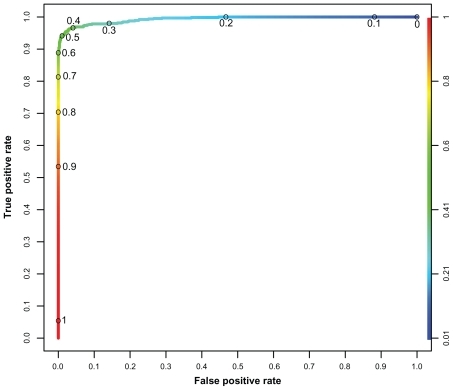
Figure 4 Importance plot of the GTPases classification. The x-axis represents the normalized sequence positions, whereas the y-axis denotes the percental increase in misclassification rate.
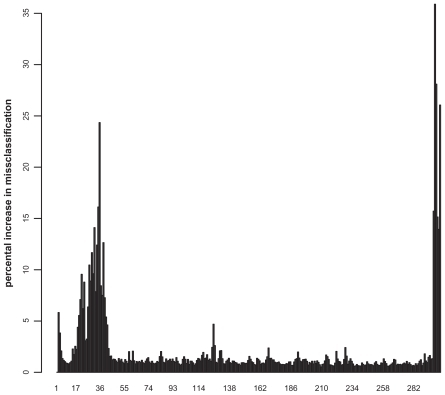
Figure 5 Most important positions for the identification of small GTPases. The most important regions (>4%) for the discrimination whether a protein belongs to the class of small GTPases are highlighted in red within the Rab6A structure.Citation27 Furthermore, the most important positions within these (>10%), are highlighted in magenta. The C-terminal part is unstructured, and thus, not shown. The Mg ion is shown as a sphere.
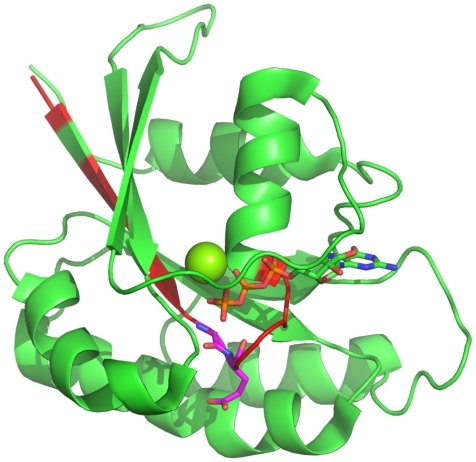
Table 2 Family classification. The mean AUC values, standard deviations (sd) and coefficient of variation (cv) are shown for each family of small GTPases
Figure 6 Sequence alignment.
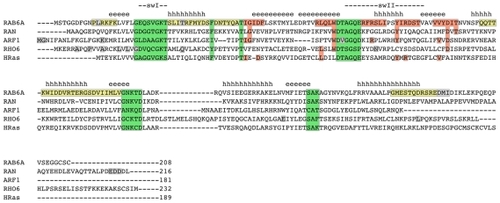
Figure 7 Most important positions for the classification of small GTPase families.
The most important regions (>4%) for the classification of whether a protein belongs to a specific family are highlighted in red. The most important positions within the Ran subfamily is located in the C-terminal part of the protein, in an unstructured region, which is not shown here. Mg and Ca are shown as spheres.
A: Structure of Rab6A;Citation27
B: Structure of Arf1;Citation30
C: Structure of Rho6.Citation31
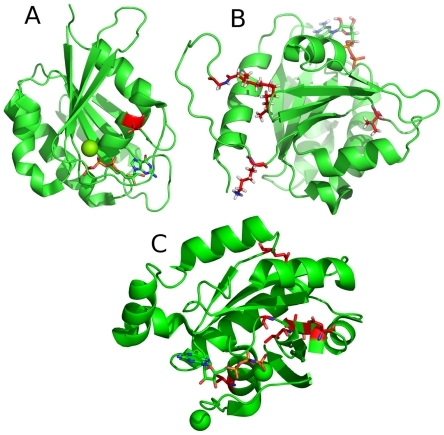
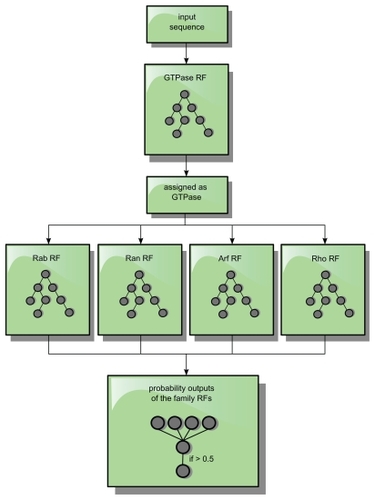
Figure 8 Classification processing flow. A sequence is only forwarded as an input sequence to the subfamily RFs, if it was assigned and identified as a GTPase by the GTPase-RF. If the highest output value of a family of RFs exceeds 0.5 for such an input sequence, the protein sequence is assigned to this specific family.