Figures & data
Figure 1 Number of atoms in insulin B chain.
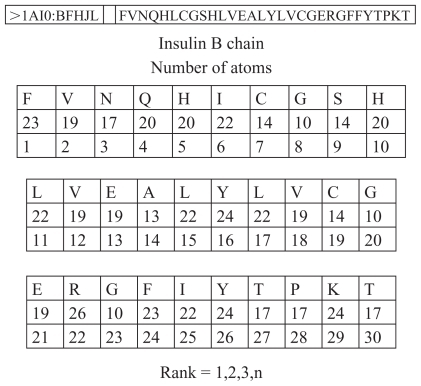
Figure 2 Fragment of insulin B chain.
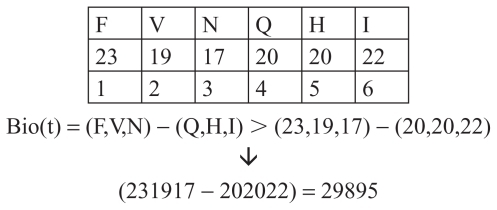
Figure 3 Examples of biocodes.
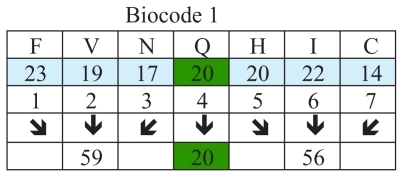
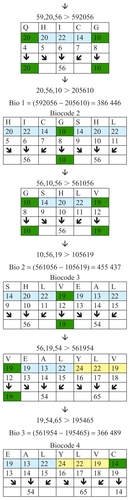
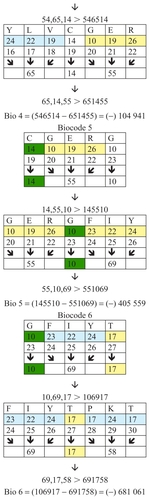
Figure 4 The formula for calculating of biocodes.
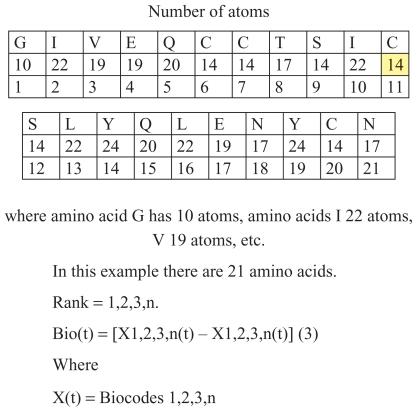
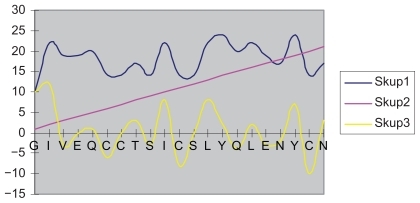
Figure 5 Examples of the connection of numbers of atoms in group of three amino acids of the insulin chain.
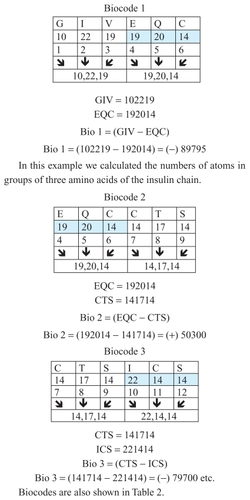
Table 1 Overview of positive and negative values of biocodes for insulin chain B showing some of the quantitative characteristics of the insulin molecule and the exact mathematical balance between its components. Schematic representation of the biocode processing (1)
Figure 6 Examples of the analog codes of insulin chain A.
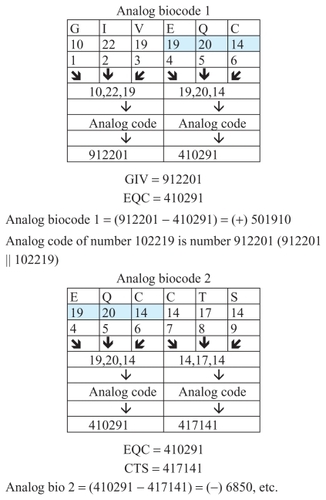
Figure 7 Group of chains E,F,G,H.
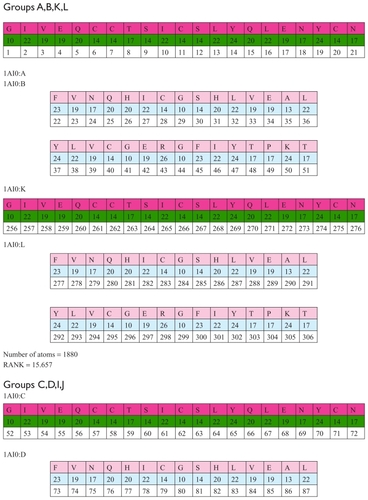
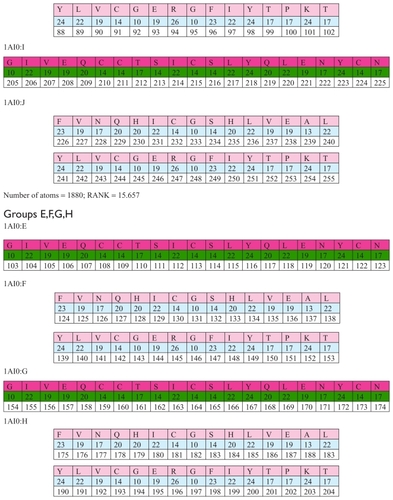
Table 3 mathematical balance between positive and negative values of analog codes of insulin chain A. Schematic representation of biocode processing (3)
Figure 8 A schematic diagram to show the positive and negative output biocodes.
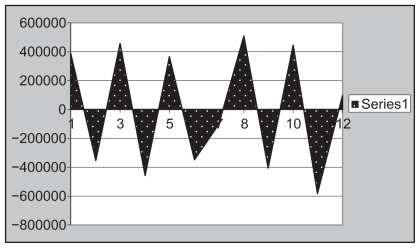
Figure 9 Groups of chains (A,B,K,L), (C,D,I,J) and (E,F,G,H).
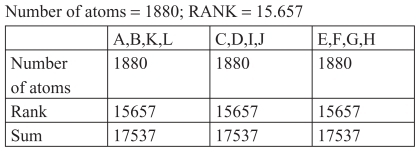
Table 2 Overview of the mathematical balance between the positive and negative values of the biocodes of the insulin A chain. Schematic representation of biocode processing (2)
Figure 10 Distribution of amino acids according to the criteria of mathematical similarity or difference.
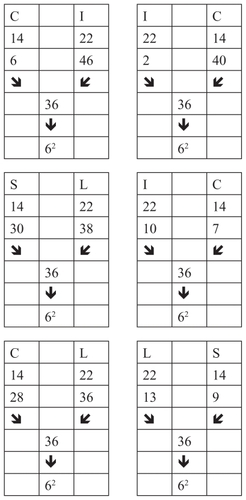
Figure 11 Groups of amino acids connected by the discrete code 11.
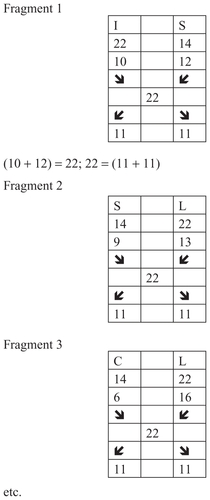
Figure 12 Discrete code 11 connects groups of amino acids.
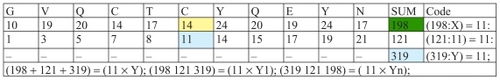
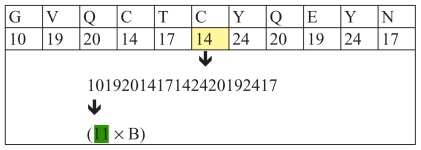
Figure 13 Connection of the rank of amino acids G and N.
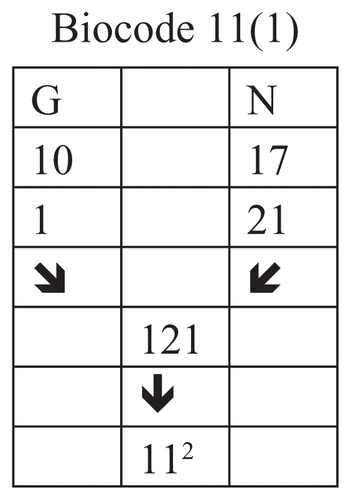
Figure 14 Connection of the rank of amino acids V and Y.
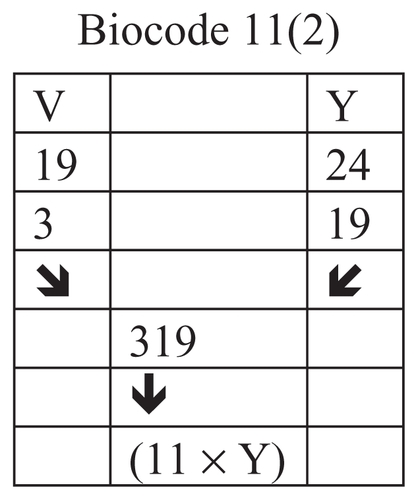
Figure 15 Connection of the rank of amino acids Q and E.
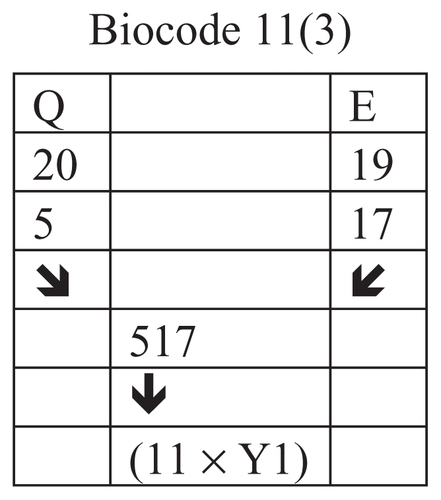
Figure 16 A schematic diagram to show the positive and negative output biocodes of the insulin A chain.
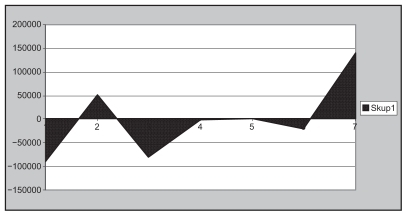
Figure 17 A schematic diagram to show the positive and negative output analog biocodes of the insulin C chain.
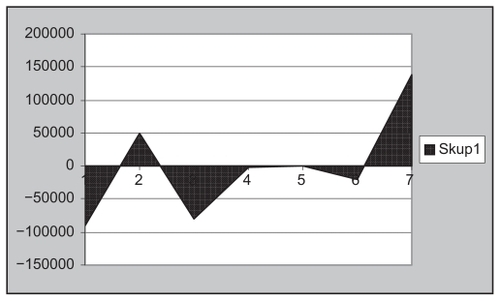
Figure 18 Frequency of insulin.
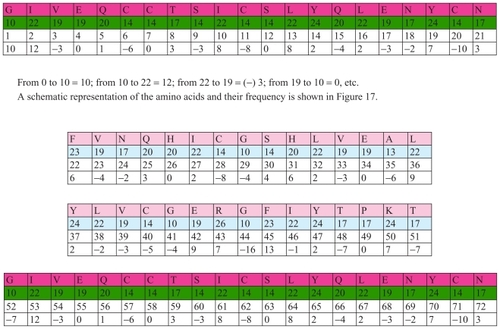
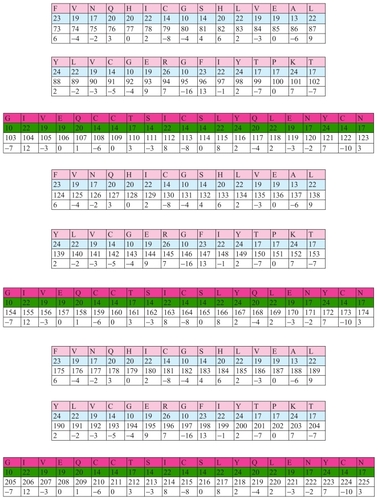
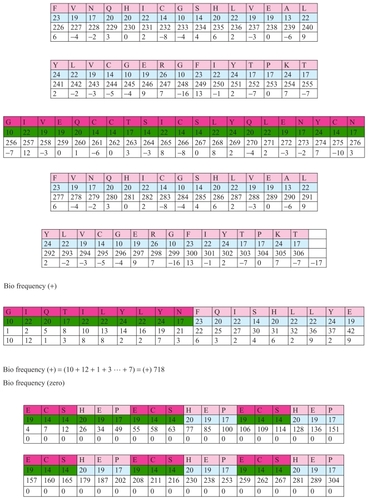
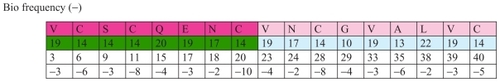
Figure 19 Bio frequency (+), (−), and zero.