Figures & data
Figure 1 Autoradiographic localization of 90Y-ibritumomab tiuxetan from lymph node on a patient sampled 4 days after treatment.
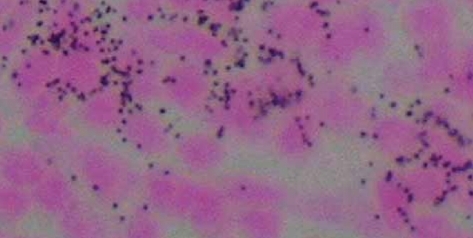
Table 1 Effect of prior treatment on response to radioimmunotherapy (RIT) in follicular lymphoma (FL)
Table 2 First-line therapy in follicular lymphoma (FL) with sequential chemotherapy followed by radioimmunotherapy (RIT)
Figure 2 Panel 1 shows large left lung mass on CT scan with corresponding FDG-avidity, biopsy proven follicular lymphoma. Panel 2, 3 months later shows resolution of mass on CT scan and FDG-negative scan. Panel 3, 12 months after 90Y-ibritumomab tiuextan shows infiltrative mass on CT scan and FDG-avid area apart from the heart. Bronchoscopy was negative for recurrent lymphoma and cultures were negative. Panel 4, 24 months after treatment there is residual scarring with decreased FDG-avidity.
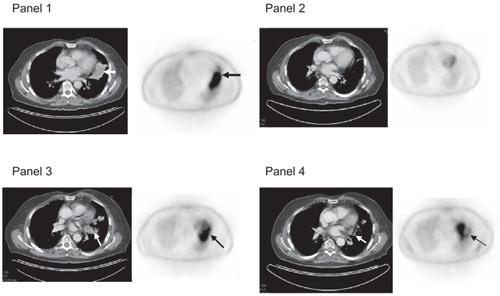
Figure 3 CT scan with moderate pleural effusion and small pericardial effusion in patient with serum-sickness like syndrome. Both effusions rapidly cleared with steroid administration.
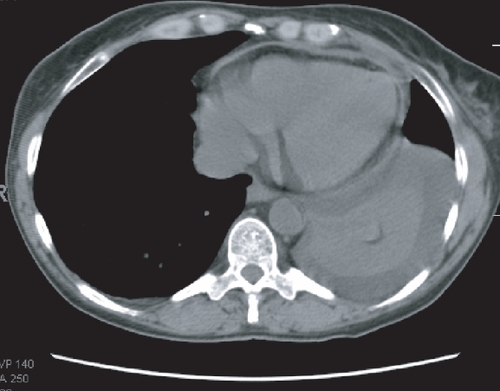
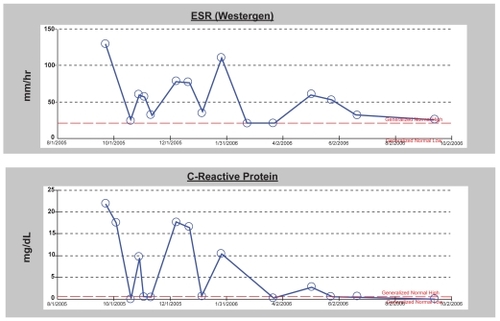
Figure 4 Graphs of sed rate and c-reative protein in patient with serum-sickness like syndrome following immunotherapy with ibritumomab aand rituximab. The rise in inflammatory markers corresponded with attempts at tapering of the dose of steroid.