Figures & data
Table 1 Baseline characteristics of study population by alcohol consumption
Table 2 Cognitive and immune baseline characteristics
Figure 1 Axial T1 weighted image of the thymus of an antiretroviral treated nonhazardous drinker. The thymus (arrow) is of intermediate signal intensity with small amounts of higher intensity fat (arrowheads) around it.
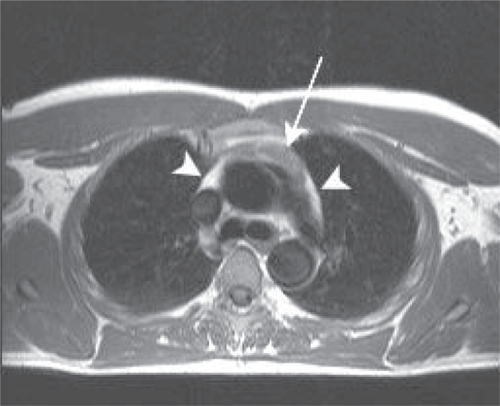
Figure 2 Axial T1 weighted image of the thymus of an antiretroviral treated hazardous drinker. The mediastinum largely consists of high intensity fat, with a small thymus (black arrow).
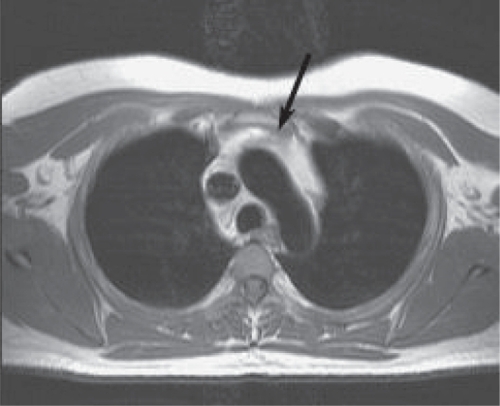
Table 3 Cognitive and immune measurements after 6 months of HAART according to thymus size
Table 4 Odds ratios for dementia according to alcohol intake