Figures & data
Table 1 The percentage of Annexin V positive and 7-AAD positive CD3+ lymphocytes and acute lymphoblastic leukemia cells following culture in the presence of no drugs (Control), 2 μg/mL daunorubicin, 50 μg/mL vincristine, 10 IU/mL L-asparaginase, 250 μg/mL prednisolone, 0.1 μg/mL garlic extract, 0.01 μg/mL ajoene, 0.005 μg/mL allitridium compared with normal healthy control subjects
Figure 1 Representative dot plots showing Annexin V FITC and 7-AAD staining of CD34 positive ALL cells and CD34 negative lymphocytes following culture in the presence of 0.1 μg/mL garlic extract for 48 hrs compared with control (Con) (no drug) (gated on CD34 positive ALL cells). Almost all CD34 positive ALL cells stain positively for both Annexin V FITC and 7-AAD in the presence of 0.1 μg/mL garlic extract but very few CD34 negative lymphocytes show signs of apoptosis.
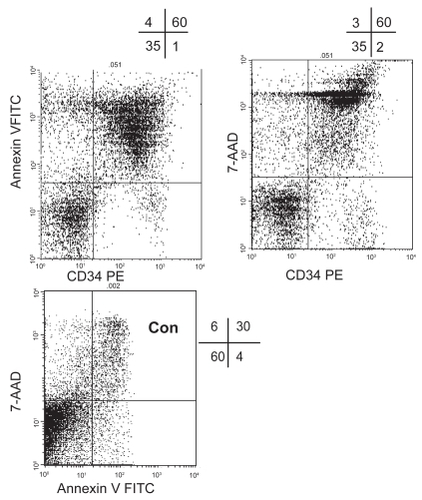
Figure 2 Representative dot plots showing CD25 FITC and CD69 PE staining of CD3 positive T cells in the presence of (A) 0.1 μg/mL garlic extract and (B) 2 μg/mL daunorubicin, compared with (C) Control, following culture with 10 μg/mL PHA for 24 hrs. There was a significant decrease in both CD25 and CD69 in the presence of daunorubicin (p < 0.05) but not garlic extract compared with control(C).
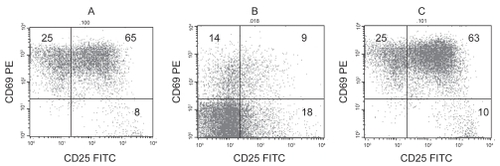
Table 2 The percentage of CD25 positive, CD69 positive, CD3 positive lymphocytes (mean ± sd) following culture in the presence of no drugs (Control), 2 μg/mL daunorubicin, 50 μg/mL vincristine, 10 IU/mL L-asparaginase, 250 μg/mL prednisolone, 0.1 μg/mL garlic extract, 0.01 μg/mL ajoene, 0.005 μg/mL allitridium compared with normal healthy control subjects
Figure 3 Graph showing dose-dependent inhibition of T-cell IFNγ production in the presence of increasing concentrations of D: daunorubicin (0.002, 0.02, 0.2, 2.0, 20 μg/mL), V: vincritine (0.005, 0.05, 0.5, 5, 50 μg/mL), Al: allitridium (0.0002, 0.005, 0.02, 0.2, 2.5 μg/mL), L: L-asparaginase (0.003, 0.03, 0.3, 3, 10 μg/mL), Aj: ajoene (0.0005, 0.005, 0.01, 0.5, 5 μg/mL), G: garlic extract (0.001, 0.01, 0.1, 1, 10 μg/mL) and P: Prednisolone (0.08, 0.8, 8, 80, 250 μg/mL).
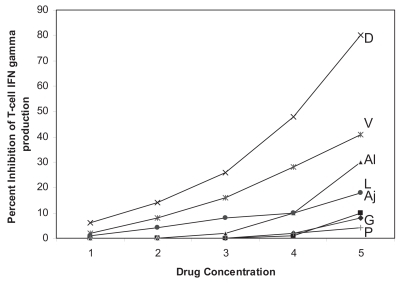
Figure 4 Representative dot plots showing intracellular CD8+ and CD8− (CD4+) T-cell production of IFNγ, IL-2 and TNFα in the presence of (A) 0.1 μg/mL garlic extract and (B) 50 μg/mL vincristine from PBMC from a patient with ALL compared with healthy aged-matched control subject (C). The percentage and mean fluorescence intenstiy of CD8+ and CD8− (CD4+) T-cell producing IFNγ, IL-2, and TNFα was significantly inhibited (p < 0.05) in the presence of vincristine but not garlic extract (p > 0.05) compared with control without drugs (data not shown). Intracellular CD8+ and CD8− (CD4+) T-cell production of IFNγ, IL-2, and TNFα by PBMC from the ALL patient was significantly decreased (p < 0.05) compared with control.
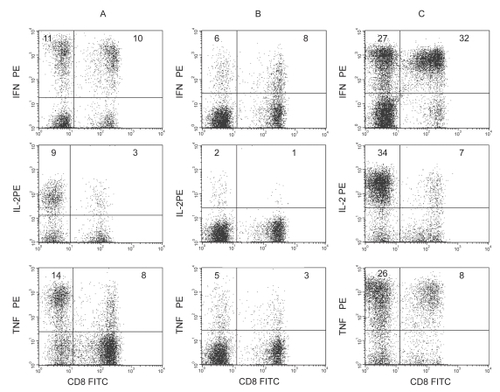
Table 3 The percentage of cytokine positive CD3 positive lymphocytes (mean ± SD) following culture in the presence of no drugs (Control), 2 μg/mL daunorubicin, 50 μg/mL vincristine, 10 IU/mL L-asparaginase, 250 μg/mL prednisolone, 0.1 μg/mL garlic extract, 0.01 μg/mL ajoene, 0.005 μg/mL allitridium compared with control subjects (n = 12)