Figures & data
Figure 1 Phenidone derivatives.
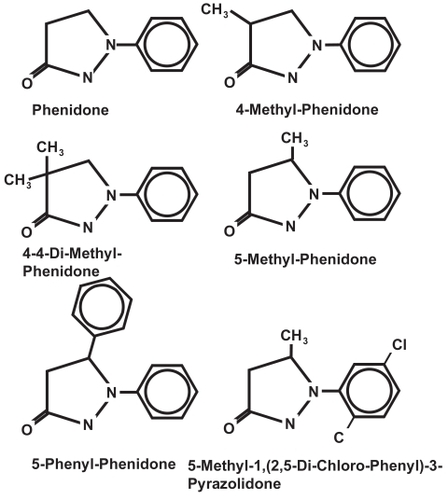
Figure 2 Experimental setup.
Phenidone or derivatives (Inhibitors-I) were added either 2 hours before (preincubation), at the same time as (co-incubation), or 2 hours after the addition of TNF-α (Stimulation-S) to human vascular endothelial cells.
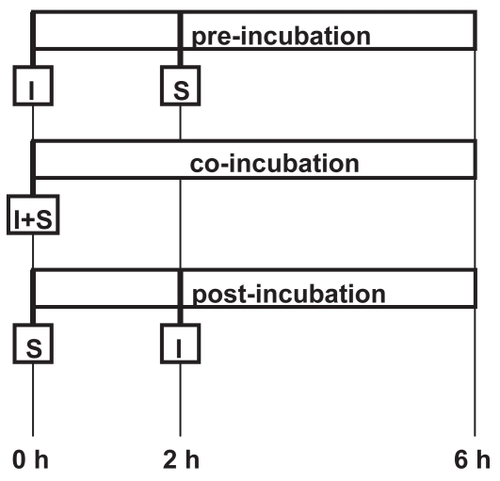
Figure 3 Inhibition of adhesion molecule expression by phenidone.
The decrease of adhesion molecule expression (ICAM-1, VCAM-1, E-selectin) is plotted in a logarithmic dose-response relationship (curve fitting). X-axis: Concentration of phenidone (μM). Y-axis: Per cent inhibition of adhesion molecule expression in relation to maximal TNF-α induced expression. Fine-dotted lines: Pre-incubation – phenidone was added 2 hours before TNF-α stimulation. Coarse-dotted line: Co-incubation – simultaneous application of phenidone and TNF-α. Solid line: Post-incubation – phenidone was added 2 hours after TNF-α stimulation.
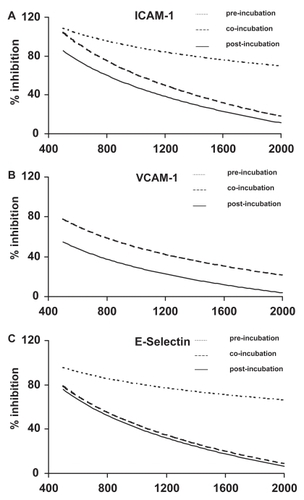
Figure 4 Inhibition of ICAM-1, VCAM-1, and E-selectin by phenidone and derivatives.
IC50: The inhibitor concentration yielding 50% inhibition of adhesion molecule expression. *=significant reduction of ICAM-1, and E-selectin expression after preincubation with the denoted derivative, compared to phenidone (p < 0.01).
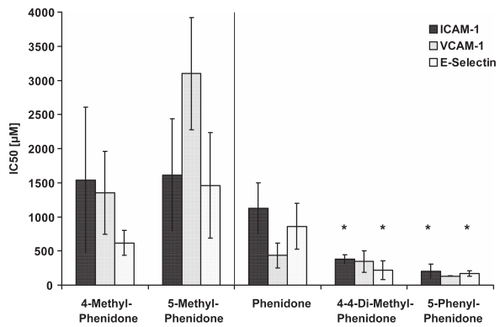
Figure 5 Endothelial-PMN interactions in the flow chamber.
Endothelial cell surface layer after activation with TNF-α for 4 hours. The experiments were performed at a shear stress of 2 dyn/cm2 with PMN (106 cells/mL). A: PMN were considered to be adherent (sticking) when a cell moved less than one cell diameter within 10 sec. Four adherent PMNs (flashes) were counted from digitized video recording. B: The same endothelial cell surface as shown in A. PMNs with rolling velocities of 0,7 μm/s were counted as rollers. In A and B four rolling PMNs were marked by circles. C: Endothelial cell surface layer after pre-incubation with 4-4- dimethyl-phenidone (400 μM). No adherent PMNs were counted from this sequence. D: The same endothelial cell surface as shown in C. Only 1 rolling PMN is counted.
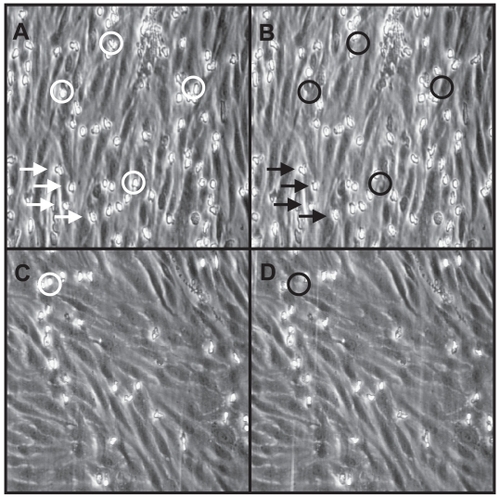
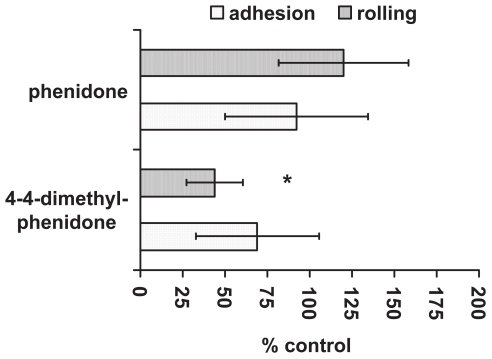
Figure 6 Rolling and adhesion of PMN to TNF-α stimulated HUVECs after pre-incubation with phenidone or 4-4-dimethyl-phenidone.
The ability of phenidone and 4-4-dimethyl-phenidone to inhibit rolling and adhesion of PMNs is shown as per cent of rolling and adhesion to untreated HUVECs. *=significant reduction of rolling when the HUVECs were pre-incubated with 4-4-dimethyl-phenidone instead of phenidone (p < 0.01).