Figures & data
Figure 1 Changes in the water content in the cortex of ischemic hemisphere. The asterisks indicate statistically significant differences vs HI group value (*P < 0.01, n = 8 for each group). LTG treatment doses and the time points of administration are indicated in horizontal axis.
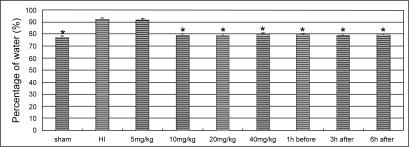
Figure 2 Photomicrographs of Nissl’s staining of the left cerebral cortex. A. A normal imaging from a sham-operated control. B. The regular architecture was destructed in the HI cortex. C. A high power view of the HI cortex, which shows necrosis of the cells with shrinkage of the cell body, pyknosis of nucleus, loss of Nissl substance, and disappearance of nucleolus. D. An imaging of the cortex from a subject received LTG of 40 mg/kg, 3 h after HI. Scale bar = 250 μm in A, B and D, and 25 μm in C.
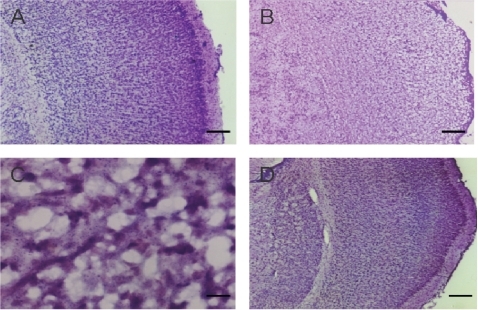
Figure 3 Photomicrographs of TUNEL staining of the dentate gyrus. A. Few TUNEL staining in the dentate gyrus from the sham-operated control. B. Marked TUNEL staining in the dentate gyrus in HI group. C. Reduced TUNEL staining in the dentate gyrus from the subject received LTG of 20 mg/kg, 3 h after HI. Scale bar = 250 μm.
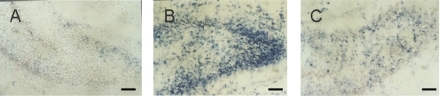
Figure 4 Comparison of the number of TUNEL staining cells in the cortex and dentate gyrus in different groups (n = 6). *Indicates statistically significant differences vs HI group values (P < 0.01). ▴ Indicates statistically significant differences between each dose groups (P < 0.01). ▾ Indicates statistically significant difference between the pre-treated and post-treated groups (P < 0.01).
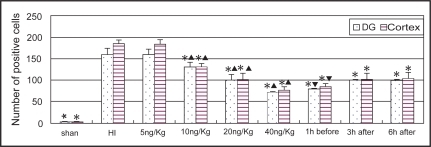
Figure 5 Photomicrographs of NSE immunohistochemical staining of the left cerebral cortex. A. Imaging shows the NSE staining neurons in the cortex from the sham-operated control. B. Reduced NSE staining in HI group. C. Imaging shows the NSE staining neurons in the cortex from the subject received LTG of 20 mg/kg, 3 h after HI. Scale bar = 50 μm.
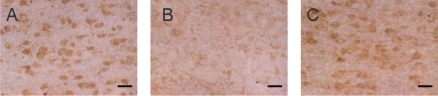
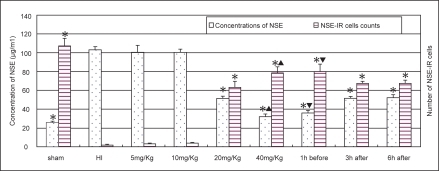
Figure 6 Alternations of the NSE level in serum (n = 8) and the number of NSE staining cells in the cortex (n = 6) in different groups. *Indicates statistically significant differences vs HI group values (P < 0.01). NSE level in serum is decreased, whereas the number of NSE staining cells is increased, comparing with HI controls. ▴Indicates statistically significant differences between LTG treated-groups of 20 mg/kg and 40 mg/kg (P < 0.01). ▾Indicates a statistically significant difference between the pre-treated and post-treated groups (P < 0.01).