Figures & data
Figure 1 SCFA distribution in fecal samples from patients classified as moderate cases (n = 19) and patients classified as severe cases (n = 16). Individual SCFA are shown as mean percentages of total SCFA concentration. Note, the proportion of n-butyric acid is higher in severe cases versus moderate cases (P = 0.016). Minor SCFAs = sum of percentages of i-butyric, i-valeric, n-valeric, i-caproic, and n-caproic acids.
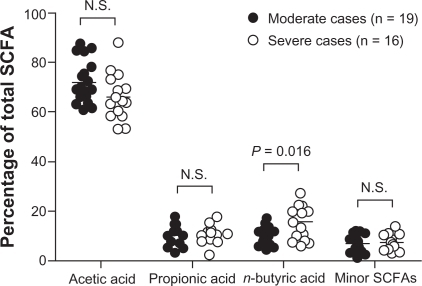
Table 1 Fecal SCFAs in patients with self-reported food hypersensitivity and healthy controls