Figures & data
Figure 1 Sections of esophageal epithelium from matched research and clinical biopsies from the esophagus. Research biopsy sections are shown on the left panel and the matched clinical biopsy sections are on the right panel. A–F are sections stained with ABPAS/D. G–L are sections stained with H&E. A and B show stratified squamous epithelium, C and D show columnar lined epithelium without intestinal metaplasia, E and F show columnar-lined epithelium with intestinal metaplasia, G and H show changes consistent with low grade dysplasia, I and J represent carcinoma in-situ, and K and L show invasive cancer.
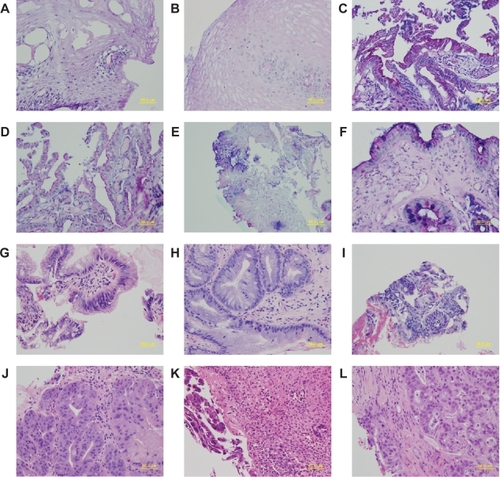
Figure 2 Number of matches and mismatches between histopathology for research biopsy vs. clinical biopsy. The type of tissue present in the clinical biopsy is named on the X axis.
Abbreviations: AC, adenocarcinoma; CLE, columnar-lined epithelium; D, dysplasia; IM, columnar-lined epithelium with intestinal metaplasia; SE, squamous epithelium.
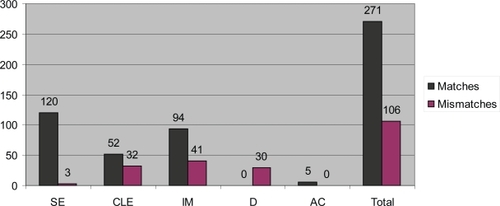
Table 1 Matches and mismatches between research histopathology results vs. clinical histopathology