Figures & data
Figure 1 (a) Age distribution of 3924 consecutive patients admitted to hospital as an emergency with a diagnosis of heart failure between 2003 and 2005. (b) Age distribution of 2002 consecutive patients being followed up for a diagnosis of heart failure due to left ventricular systolic dysfunction in a community heart failure clinic.

Figure 2 Box plot of beta-blocker versus placebo for older patients in each of the major randomized studies of beta-blockade in chronic heart failure. Point estimates and 95% confidence intervals next to box plot. (Redrawn from CitationDulin BR et al (2005) with permission).
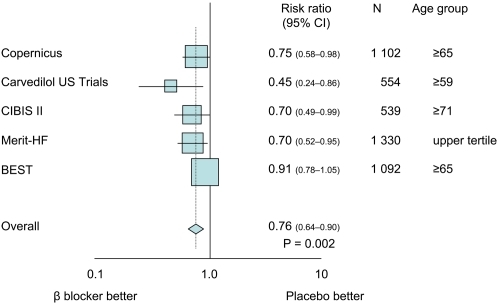
Figure 3 Kaplan–Meier analysis of time to death in the placebo group and the carvedilol group. The 35 percent lower risk in the carvedilol group was significant: p = 0.00013 (unadjusted) and p = 0.0014 (adjusted). (Reprinted from Packer M et al [106] with permission).
![Figure 3 Kaplan–Meier analysis of time to death in the placebo group and the carvedilol group. The 35 percent lower risk in the carvedilol group was significant: p = 0.00013 (unadjusted) and p = 0.0014 (adjusted). (Reprinted from Packer M et al [106] with permission).](/cms/asset/66c3ff3a-68b3-4b73-ac34-32a0e0c6dd23/dcia_a_1044_f0003_b.jpg)
Figure 4 Time to (a) first occurrence of events (all cause death or hospital admission for a cardiovascular reason – primary endpoint) and (b) all cause death in patients randomized to nebivolol or placebo. (Reprinted from Flather MD et al [137] with permission).
![Figure 4 Time to (a) first occurrence of events (all cause death or hospital admission for a cardiovascular reason – primary endpoint) and (b) all cause death in patients randomized to nebivolol or placebo. (Reprinted from Flather MD et al [137] with permission).](/cms/asset/1b78ddd2-6a55-41a5-bb74-27c0773b4e17/dcia_a_1044_f0004_b.jpg)
Figure 5 Kaplan-Meier estimates of all-cause mortality for carvedilol and metoprolol. The hazard ratio was 0.83 (95% CI 0.74–0.93, p = 0.0017) in favor of carvedilol. (Reprinted from Poole-Wilson et al [144] with permission).
![Figure 5 Kaplan-Meier estimates of all-cause mortality for carvedilol and metoprolol. The hazard ratio was 0.83 (95% CI 0.74–0.93, p = 0.0017) in favor of carvedilol. (Reprinted from Poole-Wilson et al [144] with permission).](/cms/asset/828ec431-a234-4b1a-bd5c-54ce2efd2bbc/dcia_a_1044_f0005_b.jpg)