Figures & data
Figure 1 Schema representing the gender difference of the inner structure of skin and subcutaneous tissue. Modified from CitationMüller and Nürnberger (1972).
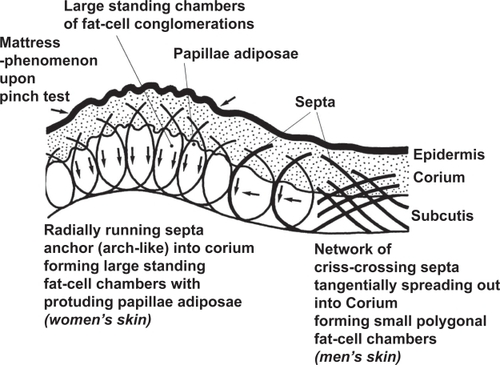
Table 1 Grading of cellulite
Figure 2 Human resources: distributions of 21 female test persons. Left: histogram for age, middle: histogram for body mass index (BMI), right: histogram for grading of cellulite according to .
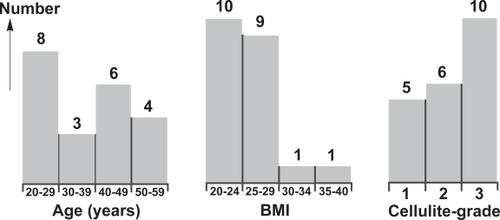
Figure 3 Collagenometry (Collagenoson®) taking high-frequency high-resolution ultrasound measurements of the extra-cellular matrix of the skin before and after treatment with low energy defocused extracorporeal shock wave therapy (ESWT). Case of improvement-score of +2 (clear improvement). Both ultrasound samples taken from the treated area. Determination of improvement-score: dividing the dermis into the side to the epidermis and into the side to the sub-cutis and analyzing the change in the distributions of each side (−1: change to more irregular, 0: no change, 1: change to more regular).
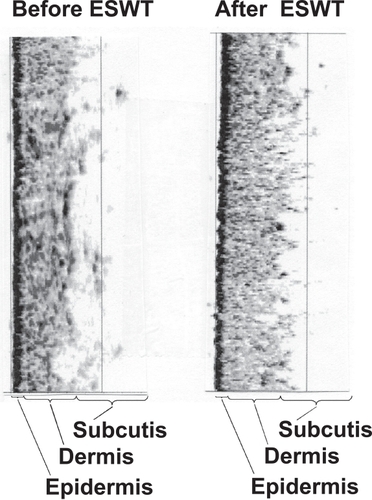
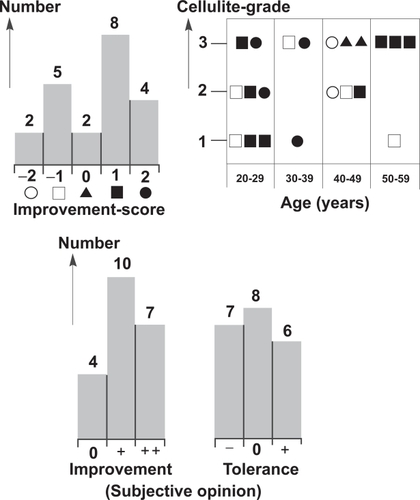
Figure 4 Results: distributions of 21 female test persons. Upper left: histogram for improvement score (see , −2 (![]()